Motorpoint (LSE: MOTR)

Motorpoint           Bryce Dooley

LON: MOTR           http://www.bdcapital1.com

Price £3.60           brycedooleybiz@gmail.com

Market Cap £325m           Twitter: @BDools2

Long

Motorpoint is the leading independent omni-channel retailer of used cars in the UK. The company doesn’t rely on any single OEM brand and focuses on retailing 0-3 year old cars with less than 30,000 miles. Motorpoint also operates auction4cars.com, its online wholesale business, which allows it to buy and sell cars that fall outside of its retail criteria.

As an independent car supermarket, Motorpoint is able to sell any make of vehicle without the traditional expensive showrooms and operating mandates that are put on franchised dealerships by their respective OEM. Motorpoint has developed its own brand as a trusted dealer of quality used vehicles, with an operating model focused on low overhead and high turnover in order to provide low prices.

The business model focuses on key factors that drive consumer buying decisions and generate repeat customers:

  1. Choice. Used cars differentiate as they age. Make, model, age, mileage, features, modifications, condition, and price-point all make each used car unique in some way. For consumers looking for a specific car or price, Motorpoint has 4,000 to 6,000 vehicles in stock at any given time that it can transfer throughout the UK, and they turn this inventory every 30-40 days.
  2. Value. As the largest independent dealer, Motorpoint has the purchasing scale, volume, and cost leverage to pass savings to customers and offer the best prices on used cars 0-3 years old. This is evidenced by Motorpoint’s price promise. If a customer can find a like-for-like car within 7 days at a better price, they will refund the difference and provide a £50 Amazon voucher. In 2019, Motorpoint revealed that only 0.11% of 36,000 customers made a claim on the price promise. Additionally 92% of drivers in a survey said Motorpoint’s prices can’t be beaten. I will further detail their price advantage later on.
  3. Service. Motorpoint names itself the “Car Buyer’s Champion” by giving customers control to do things on their terms in a simple and easy process. Customers can buy how they want: online, in-store, online & pickup in store, same-day driveaway, and home delivery. Customers can also get ancillary products and financing. The entire process of buying a used vehicle can be done in-store or online at no-haggle. It’s a low-stress experience compared to a traditional dealership. 

Management and Employees

Motorpoint’s greatest assets are the people that form its brand. Much of its strong financial returns are driven by brand, trust, and customer service that result in abnormally high volumes. Leading the company are CEO Mark Carpenter and Chairman Mark Morris who each own 10% of the shares (£30 million each). This ownership dwarfs the CEO’s annual compensation of £400,000, so he’s incentivized to drive long-term value in the stock. 

Mark has been with the company for a decade and CEO since 2013. He promotes returning cost savings to customers through low-prices (think Costco) and does not manage to maximize short-term profit. This is a telling quote from the FY21 results call: 

“Always making the product better, always investing in the customer. If I need to take a margin hit to make sure the product is the right thing that the customer wants, I will do that. Because providing that value and that excellent service and that high quality product is the most important thing for the long-term health of the business.”

Growth has been funded from cash flow, slow, and measured to perfect processes and teams in place at branches. Executive compensation was voluntarily reduced during the COVID lockdown in order to maintain lower-level employees at 100% pay. Mark Carpenter received a salary equivalent to minimum wage for two months. I think that speaks volumes to culture and the extent leadership is willing to go to for the long-term health of the business. Mark also meets with all new hires and frequently meets with teams throughout the company.

As a result, employees are highly engaged. Motorpoint placed 18th in The Sunday Times Best Large Company to Work for (made the top 100 the last seven years) and 1st in the Automotive sector. Employees become shareholders through the company’s share plan. Motorpoint trains and promotes from within, and also gives employees two paid-hours off each month to do something important to them. Team turnover has been reduced the last several years.

Engaged employees reduce bureaucracy and increase business adaptability. Employees are more open to trying new roles to best serve customers. This is evidenced by the home delivery rollout in 2020 that delivered 9,000 vehicles compared to zero in 2019. There appears to be a culture of happy, engaged, and invested employees that believe in the business and serving customers. This contributes to the “evolutionary survivability” of the organization and makes it more durable. This also leads to satisfied customers.

Customers

Motorpoint’s metrics for customer satisfaction are almost unheard of in the auto industry. H2 2020 Net Promoter Score (likelihood of a customer to recommend) reached an all-time high of 83%, up from 77% in 2018. This stacks up with Costco at 87%, Amazon at 87%, and Apple at 85% to show how well regarded the Motorpoint brand is. Average car dealership NPS is around 40%.

This satisfaction shows up in Motorpoint’s percentage of sales from repeat buyers, which also hit a high at 33%, up from 26% in 2017. This number has gradually risen because it takes several years for a first-time buyer to become a repeat buyer. The average repeat buy cycle is 3.5 years between vehicle purchases, so as Motorpoint’s branches and customer cohorts have matured past one or two repeat cycles, more and more buyers are coming back again.

Competitive Moat

I believe Motorpoint is able to offer the lowest prices and generate great cash returns on investment due to industry leading sales volumes that are a result of its brand reputation and customer trust. Volume driven by brand reputation cannot be bought by competitors or created from scratch. Motorpoint has built its brand and processes over the last 23 years and now has significant scale in its existing markets.

Evidence of this customer trust can be seen in the fact that 40% of cars Motorpoint sells are ordered sight unseen, and most of those are purchased without a test drive… that is 20,000 to 30,000 cars retailed each year either to a repeat buyer or without a test drive. A significant portion of customers clearly have a lot of trust in Motorpoint to get them a quality used car at the right price.

This is a similar model to CarMax in the U.S. However, Motorpoint takes volumes and pricing to an extreme that I believe makes its competitive position and earnings more durable than CarMax and the average business. 

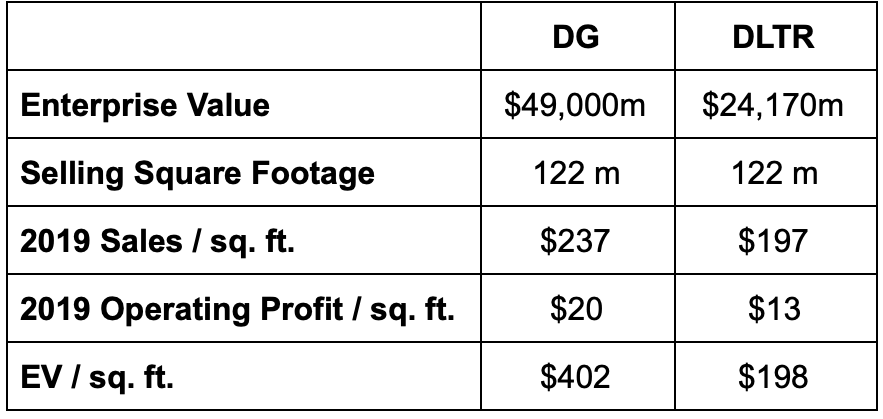
I think of this Motorpoint to Carmax comparison like a Costco to Wal-Mart comparison of retail models. Wal-Mart maintains competitive prices and an abundance of locations that are fairly accessible to the majority of the population. Costco, on the other hand, has fewer locations in major population hubs and absolute pricing authority thanks to high turnover and a reputation for quality goods at the lowest prices in a super-scaled warehouse format. Here are operating metrics that show the volume differences of Motorpoint and its similarities to Costco’s approach to retailing (all USD):

I believe this demonstrates that Motorpoint has taken the Costco model of a niche focus (0-3 year old vehicles), low gross margins, low overhead, and high turnover. This creates a virtuous cycle of happy customers returning for tremendous value, further increasing volumes and allowing for even better prices or profits at larger scale.

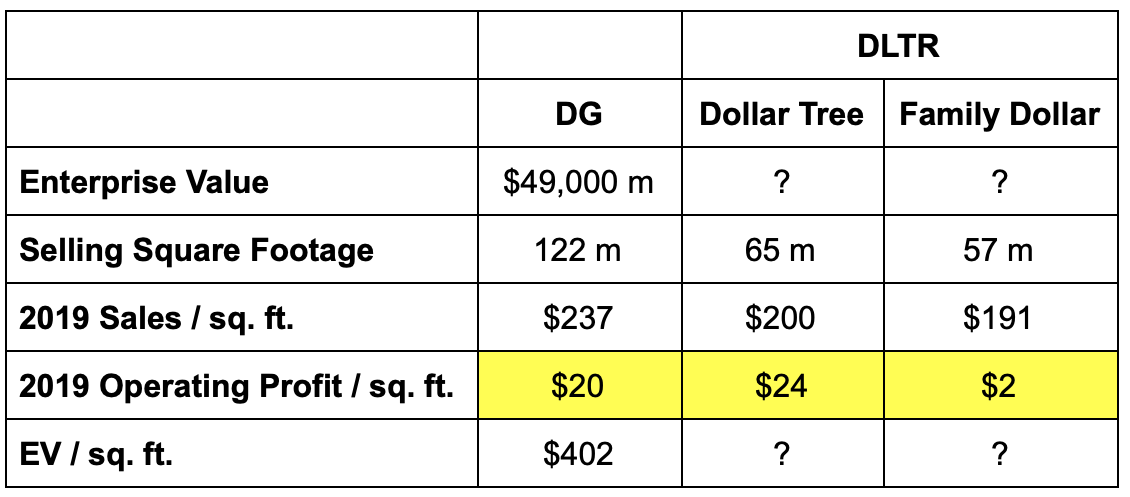
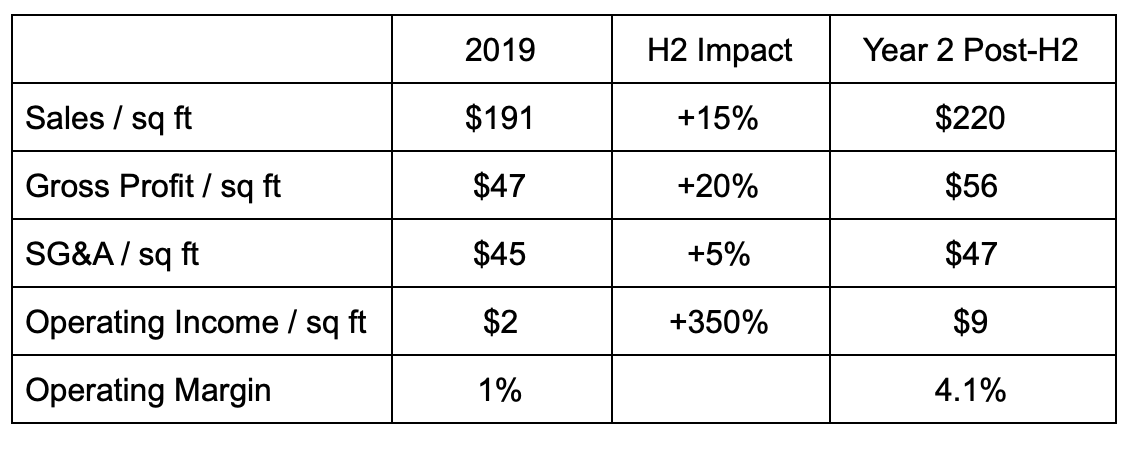
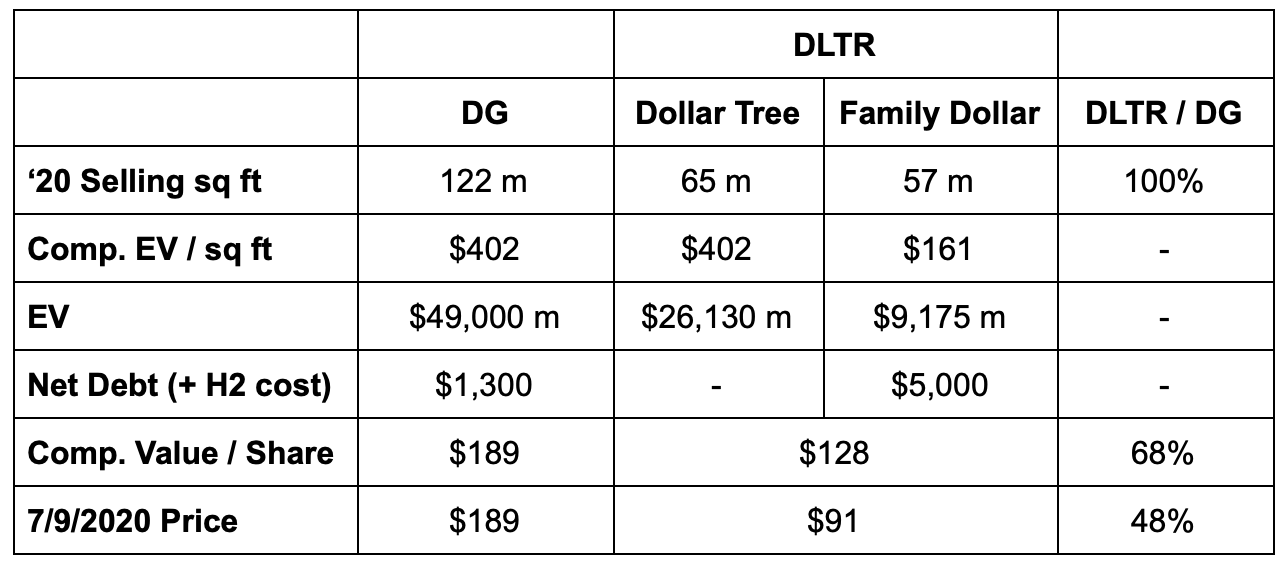
This competitive advantage not only allows Motorpoint to maintain a loyal customer base leading to more consistent future revenues, but also creates very high returns on invested capital from operating leverage on fixed costs – even at low gross margins. Here is an estimate of the typical mature Motorpoint store based on annual reports and comments from management. Also given is an example of the effect margins and operating profit if volumes were 25% lower, such as that of a CarMax store, or if Motorpoint did not have so many repeat buyers. Also shown are the estimated effects on the cost structure at lower volume. (All in £s)

As shown, the additional volume Motorpoint generates due to its brand increases mature operating margin by 50% and doubles operating profit at the store level. The incremental operating margin on the additional sales is over 5% compared to existing margins near 2%. This scale leads to return on store and prep center capex near 100%. These numbers can be checked against -30% revenue for FY21, when SG&A fell 12%.

Supply Advantage

A possible constraint to Motorpoint’s growth is their ability to source enough vehicle supply to meet a growing customer demand at attractive prices. They buy the majority of their vehicles from corporate fleets, leasing companies, leasing arms of OEMs, and auctions. OEM manufacturing economics support the continued supply of cheap vehicles into these secondary channels (albeit an ongoing hiccup due to COVID disruptions). From Motorpoint’s IPO prospectus: 

“The use of secondary channels is attributed to the economics of car manufacturing, consisting of a high fixed cost base and relatively low marginal cost of production; together with the future income stream from parts supply. This results in OEMs being able to sell new vehicles to fleet managers and vehicle rental companies often at a significant discount to list price. The Group then purchases nearly-new vehicles from such fleet managers, vehicle rental companies and also the OEMs’ own leasing arms.”

Motorpoint has well-established relationships with these secondary vendors, with 9 of the top 10 supplier relationships spanning over ten years as of the 2016 prospectus. In 2015 they purchased from 280 different vendors.

Motorpoint is a critical player in the business model of these vendors. Motorpoint has scaled buying power and quick distribution which creates a strong sales outlet for vendors looking to get rid of vehicles (speed and price are the biggest factors in these transactions). On the FY2021 results call, CEO Mark Carpenter gave his expectation that they will continue to get supply because they stick to their prices, have the distribution to move vehicles quickly (scale & quick turnover), then be back to the vendor to buy more the next day. He stated that the product finds Motorpoint because they create sales run rate. 

Additionally, Motorpoint is able to flex its buying criteria to expand its supply market or address vehicle shortages like the current COVID supply disruption. In the 2016 IPO prospectus, they highlighted their focus as 0-2 year old cars with under 15,000 miles. That focus has already changed today to 0-3 year old cars with under 30,000 miles. Starting this year they will also begin buying cars directly from consumers, even without a purchase from Motorpoint, which will open up more supply. This shows adaptability of the business model.

Finally, Motorpoint has established inventory financing relationships that enables them to source large deals and maintain over £100 million of inventory. These facilities aren’t available to smaller lots or startups that don’t have sales distribution, experienced vehicle acquisition processes, or extensive transaction value data. 

Data Advantage

The lack of up-to-date, accurate market value data poses risks in used car retailing. Market values shift based on supply and demand. Inaccurate or old data can result in paying too much for vehicles as the market cools off or mispricing vehicles for retail. This has a significant effect on profit and cash flow when operating at low gross margins. 

Motorpoint’s rapid inventory turnover gives it the most extensive information related to vehicle transaction values. They turn inventory an industry-leading 11x per year, and wholesale auction inventory every 14 days. During volatile market periods they are better equipped to read the market and protect gross margins. Buyers are better able to source vehicles at attractive prices and avoid overpaying when the market turns. The wholesale action business sells 30,000+ vehicles each year and is another source of data to Motorpoint’s advantage.

On the FY2021 results call, Mark Carpenter compared Motorpoints 11x inventory turnover to Cazoo’s “aspirational” 4x turnover and noted that the currently elevated used car market will correct at some point. He explained how Motorpoint will be in and out of the market before other players realize what’s happened to valuations and “catch a cold”.

Growth Opportunity

In the past, Motorpoint has taken a controlled growth approach targeting 20 stores (from 12 in 2019) with one new per year. With the market shift to online, rollout of a complete omni-channel offering, and increasing competition, they are now pedal to the medal to capture the current opportunity to take market share. The newly revealed growth strategy represents an acceleration and pivot.

Motorpoint is now creating a hub and spoke infrastructure model with large-scale vehicle preparation centers, 14 existing large showroom sites to maintain and retail inventory, and then 12 planned smaller “spoke” branches that will act primarily as sales outlets to bring Motorpoint closer to customers and improve logistics. 5 of the 12 new branches are already in advanced stages and will increase Motorpoint’s branch network from 14 to 19 rather quickly. These spoke branches will have lower volumes but capture incremental market share. Small sites are becoming available at attractive costs due to OEMs rationalizing their dealer networks and smaller dealers closing (increasing online and delivery market requires less physical infrastructure).

Added preparation sites will increase Motorpoint’s vehicle capacity from 100k to 200k. This will take preparation off of existing sites to achieve centralized prep scale and keep the stores sales oriented. The increased volume will leverage fixed costs and subsequently decrease prep costs per unit. FY21 was the first year with a prep center and decreased prep cost/unit from £213 to £198 even with significantly lower sales volumes. This number should go lower as these centralized hubs double vehicle throughput and leverage fixed costs.

The strategy behind the 12 new small branches is to increase the % of the UK population within 30 minutes of a Motorpoint branch. Currently, two-thirds of the population are within 60 minutes of a branch and Motorpoint has 6% market share of that cohort. They have found that customers are much less likely to put in effort and travel to find great value. This is evidenced by the key fact that Motorpoint has 10% market share of the customer cohort within 30 minutes of a branch. The new availability of smaller “spoke” sites will allow Motorpoint to increase the % of the population within 30 minutes of a site to 70-80%. Simply adding a branch to a region that didn’t previously have one takes market share from 3% to 10% in the first year. Physical brand presence in a market significantly increases share, and online-focused players are behind on this. In-store sales still represent over half of the market.

Relative to Motorpoint’s recent market share of around 4%, this growth strategy can result in a doubling of sales in the medium term and further growth long-term. Other evidence that Motorpoint’s UK market share has significant room to grow:

  • Highest market share regions are at 25% share. These are stores #2 Burnley (2001) and #4 Newport (2005).
  • Management has confirmed the older stores do ~£100 million in revenue. This compares to £88 million per store simple average for FY19 and £55-£60 million year one sales for new sites per the IPO prospectus. 4 of 14 stores are under five years old. Stores gradually ramp sales and market share as the repeat buyer cycle turns every 3.5 years.
  • Branches over 8 yrs old have 13% market share, branches under 8 years old have 8% share. 7 of 14 Motorpoint branches are under 8 years old.
  • On FY21 call Mark Carpenter stated that mid-teens share of the 1.5m unit market is possible.

The increased online penetration in the industry should result in accelerated consolidation towards large players in the next few years. A large marketing budget, brand awareness, and price transparency will drive traffic to websites with low prices and selection (Motorpoint). Small dealers will not be able to justify large IT and marketing expenditures, nor will they be able to match infrastructure efficiency of home delivery / vehicle transfer logistics. Motorpoint is the largest player in its segment by volumes and plans to ramp its marketing budget thanks to its cash generative business model. Newer entrants are burning cash in operations and using equity raises to create brand awareness. Motorpoint has already built its brand over the past 20 years.

Motorpoint is taking a CRM focus to marketing.They have over 800,000 unique customer email addresses in their database. These customer relationships have been developed over the past two decades of operations and are either not available or not as established to new entrants. Their goal with CRM marketing is to lower the repeat customer cycle from 3.5 years to 3.2 years. This increases transactions and the addressable market by 10%. Management says that excessive sponsorship marketing (Cazoo) is not a very effective use of marketing dollars once general brand awareness is achieved.

It’s likely that the percentage of sales to repeat customers figure, at maturity, is much higher than the 33% figure for sales in FY21. The repeat cycle is 3.5 years, so it takes years to increase that number even with high customer satisfaction. Two branches are under two years old and two others are under five years old. These branches drag the 33% repeat number down. 

Marketing costs will impact margins over the next few years but I see these costs as investing through the income statement to capture the current opportunity. Some of the increase will be offset by lower prep/unit costs as prep centers scale up as discussed above. 

I also expect gross profit to increase faster than sales due to increasing finance penetration online. This number has been lower than in-branch penetration but rising as Motorpoint develops its online sales model. From FY19 to FY21, online gross profit rose 43% while online volumes rose just 21%.

Valuation

Management is targeting £2 billion revenue and 2-3% EBIT margins by FY24. This translates to roughly 120k retail units (8-9% market share) and 80k wholesale units (5% market share). This revenue target is quite achievable given:

  • Mature stores have market shares of 10-25%
  • A significant increase in the population cohort within 30 minutes of a branch (10% market share) from the 12 new small branches
  • Established, trusted brand + increased marketing efforts
  • Another turn of the 3.5 year repeat buyer cycle
  • Added direct-from-consumer wholesale supply and low auction fees

2-3% EBIT margins are achievable. Even operating subscale with growth expenses the past several years Motorpoint has been operating near a 2% margin. Gross profit can skew to the upside (above 8%) due to increasing finance penetration and improved pricing. Marketing costs will reduce margins in the short-term but I don’t expect a marketing war to develop long-term. These costs will be offset by efficiencies in vehicle prep and leveraging fixed SG&A costs on double the unit volume.

These targets would result in around £40 million net profit in FY24, almost all of which is free cash flow that can be distributed to shareholders. These numbers certainly have room to grow past the medium term, both beyond 8% market share and 2.5% EBIT margin. This is demonstrated by older store markets having 13-25% market share and mature branch economics at a 3% EBIT margin (mature branch revenue and gross profit to overheads ratio confirmed by CEO). Motorpoint can continue to grow finance penetration and ancillary products to add to margins over time. All of this is possible if Motorpoint maintains its brand reputation and delivers extreme value to customers, which management clearly intends to do. 

Today’s enterprise value of £320 million is already up substantially from £230 million just two months ago (when 80% of these facts were available) yet still represents good value considering the business outlook. Management’s new strategy presentation has validated business progress and attracted interest in the stock since June. 

Today’s market cap is 8 times expected FY24 cash flow. Over the next three years Motorpoint will also generate £15 to £25 million of free cash annually, at lower margins as they ramp to £2 billion in sales. This cash will be distributed to shareholders. Within two or three years I expect a double-digit free cash flow yield on today’s price. This is too cheap for an advantaged, growing business run by a strong management team, and a forward valuation outlook that is very difficult to find today. Relative to other growth/quality companies trading anywhere from 12 to 15 times three-years-out FCF, Motorpoint is at least 25% undervalued, and likely more given the economic durability and growth runway. With shareholder friendly buybacks and dividends, the rate of value compounding can be very attractive from recent valuations.

With a strong economic moat, customer proposition, and shareholder-aligned management team, I expect Motorpoint will be worth £500 to £600 million in 2024, with ~£50 million of dividends and buybacks until then, backed by roughly £40 million annual cash flow that should continue to grow with market share. Considering a range of outcomes with regards to exit multiples, capital return, and where margins settle, this should result in a probable 15% to 25% IRR over the medium term, and the upside potential for multiples of invested capital long-term.

Risks

  1. New online entrants like Cazoo and Cinch have significant capital from equity raises, larger marketing budgets, and may capture a disproportionate share of the market as it shifts online. I expect this to impact Motorpoint the least as it has a more comprehensive offering along with established operating processes. I don’t expect a marketing war to develop and crush margins. Management stated that once general brand awareness is achieved, excessive sponsorship marketing is not very effective. Industry marketing should eventually settle down to instead focus on digital traffic, selection, and value. Also noted by management, everything that Cazoo is doing now has already been built by Motorpoint over the last twenty years. Motorpoint has cumulatively spent £100 million on marketing and sold over 400,000 vehicles at retail, developing best practices along the way. Cazoo is starting this now with a big budget and online focus. They lack the established processes and data that Motorpoint has.

I also don’t expect online-focused competitors will scale toe-for-toe with Motorpoint’s established physical presence. Management noted the geographic difference with regards to online-penetration in the UK. The south of the country is 65% online and 35% in-store, while the north is the opposite. In-branch sales are still a significant portion of the market. Motorpoint will capture a greater share of the in-store market and hold its own online thanks to wide selection and low prices.

  1. New car supply chain disruption due to COVID is causing a shortage of used inventory. This will likely reduce Motorpoint’s addressable market in the 0-3 year old vehicle segment and impact sales in the short-term. This is a transitory and not existential issue. Carpenter said they are willing to dip into the 3-4 year old segment to offset supply challenges. As shown already, the business model is adaptable to meet supply and demand changes and can flex inventory criteria.

Catalysts

  1. Low actively traded float. Insiders own 20% of the shares outstanding. Seven other investment funds combined own another 40% of the shares, and those are just the positions large enough to be disclosed in the annual report. I don’t believe these funds are selling anytime soon or near this valuation, and I also expect there are more long-term fund/individual shareholders beyond the 40% number. It’s likely that at least 70% of the shares outstanding are unwilling to sell their shares without a much higher valuation (myself included). Add the fact that Motorpoint has a buyback program in place (shares outstanding down 10% since 2018) which further reduces the available shares for incremental buyers and funds to build positions. Average daily volume is 0.08% of the market cap so it would take serious bidding for a buyer to build a material position in a reasonable amount of time. 
  2. FY22 and FY23 market share and sales results from added branches.
  3. Capital return. Motorpoint plans to reinstate its dividend once there is further clarity to the current environment. They also expect to repurchase shares with excess capital.
  4. Relative valuation to Cazoo. Motorpoint has a better business model and is likely to post similar or better numbers in the coming years. Cazoo is being privately valued at £5 billion while Motorpoint trades at £320 million. I find this to be absurd.

Sources

Motorpoint filings/annual reports, exchange with management, FY21 results conference call

Berkshire Hathaway: The Most Underappreciated Retirement Stock in America

Berkshire Hathaway: Shrinking Its Way to Higher Returns… The Most Underappreciated Retirement Stock in America

BD Capital (6/21/21)

Most media and investor attention towards Berkshire Hathaway focuses on the exceptional past track record or speculation about company actions in the present quarter or year. There have been strategic shifts at the company which I believe will allow Berkshire to maintain or increase its return on equity, and I expect investor perceptions of the stock to change in the coming years.

The 2021 shareholder meeting provided new perspectives about the company’s future. The new willingness to deploy significant capital towards buybacks has a two-fold effect of creating value that goes beyond share count reduction, and I will show why. I’ll also address common arguments made against Berkshire and evidence to why they are misguided. Finally, I’ll make the case that Berkshire is the ideal equivalent of an index fund that, for some reason, few people appear to want or talk about.

Buybacks Have a Two-Fold Effect of Creating Value: Forget About Hunting Elephants

As it relates to size and the cash build-up concerns, I think investors are only starting to give credit to the capital allocation shift taking place at Berkshire. This is evidenced by the new willingness to repurchase shares consistently and in scale. In the last four quarters, Berkshire used nearly $30 billion cash to buy back its stock. That was one of the biggest single deployments of capital in the company’s history, barely behind Precision Castparts, BNSF railroad, and Apple. That’s $5 billion more cash than Berkshire can generate in a good year and was a large reduction of cash on hand. This reduced shares outstanding and shareholders equity by over 6%. This is a big change. It’s an act of Berkshire significantly shrinking itself. 

In my long-term view, buybacks like this have a two-fold effect towards increasing value. After a buyback,  existing shareholders own a greater share of the company at an attractive entry price, as Buffett will only repurchase shares at a discount to conservatively estimated value. Two, this action actually makes it easier for Berkshire to operate its capital allocation model in the future. Here’s why. 

Buybacks reduce the firm’s size and market cap because cash is leaving the building instead of adding to assets. Generally, the value of a share is little affected because there are fewer outstanding shares and the firm as a whole is worth less after the cash outflow. Relative to public and private assets that are constantly growing, and that Berkshire would be a potential acquirer of, each buyback makes Berkshire smaller. This creates opportunities on more assets that are material in size relative to a slower-growing market cap. 

The numbers can be put into perspective by two slides Buffett presented at the annual meeting to show the growth of the world’s largest companies of the past three decades:

In 1989, the Bank of Japan was the largest at $104 billion. Today, it’s Apple at $2 trillion. Two different companies in the same spot, and the growth rate of the market cap in the top spot was 10% per annum. Since 1995, the market cap of the S&P 500 grew 9% annually from $4 trillion to $36 trillion. I don’t expect either of those growth rates to be as high in the future, but it still shows that the large assets in the economy are growing at a steady clip. For Berkshire to be able to make meaningful deals on these assets, Berkshire’s size can’t grow to be so big that the potential assets don’t move the needle. Will Berkshire grow its market cap at a 10% clip if it’s buying back 3% or 4% of its shares each year? Very unlikely. 

With this put into perspective, Berkshire has now shown that it is willing to use the buyback tool which makes future capital allocation easier by shrinking and increasing the opportunity set. Berkshire’s market cap and cash pile will likely get smaller relative to public and private market deal sizes. I believe this creates a fair chance for Berkshire’s returns on equity to remain steady or slightly increase over time. A smaller Berkshire is a better Berkshire. It’s much easier to find good deals when you are worth $800 billion compared to $1.2 trillion. There are more options available that can make a difference. Given this, I’ve concluded that buybacks make the Berkshire business model more valuable going forward, with stable returns likely and higher returns possible. I expect we will see more buybacks in the future when the price is reasonable. They were on a $1.5 billion monthly pace at last disclosure at prices up to $260.

In addition to the buybacks, there is consistent ongoing capital deployment at existing businesses that is preventing the cash number from growing as quickly as many believe. Many will report that Berkshire generates $20 to $25 billion of operating earnings each year that it needs to find a deal for. In reality, the company spends more than its non-cash depreciation charge on capital expenditures to the tune of $5-10 billion a year depending on opportunities at the utility business, where all earnings are reinvested. Berkshire has massive plans for its utility business: in Buffett’s annual letter he suggested that they will be reinvesting all earnings for decades to come. That’s a lot of future cash that is already earmarked for a home.

Given this, actual free cash flow that needs to be put to work is closer to $15-20 billion per year, less than 3% of the value of the firm. While still very important capital, with an open buyback program that can knock out $10 billion of repurchases in a few months at the right price, it is quite clear that cash build is not going to be a problem at Berkshire going forward. The urgency to find big deals in the future is nowhere near the level that has been suggested by many, and eventually more assets will grow into Berkshire’s deal size range.

“But Berkshire doesn’t pay a dividend…”

The common arguments against owning Berkshire Hathaway:

  • The company is too big to allocate capital at scale going forward, evidenced by the $140 billion cash pile plus $25 billion annual cash flow, and returns will go down (disproven above). 
  • A Buffett-less future will lead to subpar performance. Current governance and succession planning is insufficient.
  • Berkshire is not involved in tech, emerging economy trends, or ESG initiatives. It owns boring businesses.
  • The company doesn’t pay a dividend.

Succession plans. I expect the loss of Buffett will have little effect on the firm other than his image and guidance for other executives. He has already delegated significant responsibility. There is a culture in the firm that embodies many of the principles that Buffett has preached for so many years, and he has put the people in place to be ready to man the ship now, if needed. Two “young” (in Berkshire context) portfolio managers are dealing with significant sums under Buffett and have proven themselves by opening the Apple position and a willingness to think independently through their investment in the Snowflake IPO, a cloud computing company. Buffett communicates and has lunch with them regularly, and I would expect they have soaked up wisdom, ideas, and the Berkshire culture.

The next CEO, Greg Abel, is already nearly as in charge as Buffett is. He has been with the company for two decades, running the $70 billion energy business, so clearly he has been part of Berkshire’s history of success. He has been available to shareholders at the annual meeting for two years now. The Berkshire operating businesses report to Abel and he provides guidance to subsidiary managers regularly. He is a straight-shooting, midwestern family man that oversees $350 billion worth of businesses while coaching his kids’ athletic teams. He has over $500 million personally invested in Berkshire’s energy business which dwarfs his annual salary. While not directly to Berkshire’s stock, his incentives are aligned and I expect they will find a way for him to build equity in Berkshire stock. Here is a great article on Abel that makes me believe that he may possibly be a better CEO than Buffett, just maybe not as good of a stock picker as the best ever: 

https://www.desmoinesregister.com/story/money/business/2021/05/03/berkshire-hathaway-ceo-warren-buffett-des-moines-resident-greg-abel-net-worth-cnbc/4928154001/

Berkshire is very involved in tech, ESG, and emerging industry trends. 15% of Berkshire’s value resides in Apple, a company that spends $20 billion a year on research and development of consumer tech products. Berkshire owns 12% of Bank of America, who has made tremendous investments in technology to lower distribution costs and provide a high-end digital consumer offering in banking. The younger portfolio managers invested in a cloud computing company IPO last year. As far back as 2008, Berkshire invested $232 million in electric vehicle maker BYD, a stake worth several billions of dollars today. Lastly, but maybe most importantly, Berkshire Hathaway Energy has become a large player in renewable energy generation. 43% of the subsidiaries power generation is from renewables and they have invested $34 billion in wind, solar, geothermal, and biomass generation. Another $2.5 billion will be deployed for wind power generation by 2022. Any other questions?

The company clearly stays invested in the direction the world is moving to. There are also old-school operating businesses, like the railroad and manufacturing companies. Investors like to discount these boring businesses, however, they are very durable assets that provide goods and services in critical areas of our economy like housing and freight. The certainty and cash flow of these businesses provide an element of safety to Berkshire’s value.

The lack of a dividend is the most ridiculous reason for an individual investor to avoid Berkshire stock. First off, a dividend creates tax liabilities on income today for all shareholders. If the goal is to maximize long-term compounding, which includes minimizing taxes, then a dividend makes no sense. Buybacks do, as they generally lead to larger unrealized capital gains (tax-deferred) and uninterrupted wealth compounding.

Shareholders that want income from their stock can simply sell a small portion of their shares each year. If that amount is close to a typical low-dividend yield, then the value of the holding will still gradually rise over time. If the “share sale” dividend is a fixed percentage of the shares owned, then the annual sale-proceeds will gradually rise over time as well, resulting in a pay-raise for the shareholder that creates their own dividend. In some cases, the tax on the capital gain of the sale will be even less than the tax on dividends would be, even with the same pre-tax proceeds, because it is a partial return of capital from the investors cost basis. It’s not the lack of income, it’s the lack of creativity by the shareholder.

Variant Perception: Berkshire Hathaway is the ideal index fund in a tax-efficient corporate structure

Buffett has designed the structure and culture of Berkshire in a way that eliminates the undesirable aspects of indexing and corporate America, while still maintaining the fundamentals that make indexing work so well. He has eliminated common inefficiencies that slow down wealth compounding that are common in S&P 500 firms. This comes in the form of:

  • Optimal capital allocation
    • No dividend taxes, buybacks only at prices below intrinsic value (not at any price to offset stock compensation), and no stock-based comp issuance. S&P 500 firm buybacks are often executed in greater size at higher prices than lows (see chart). So much for buy-low, sell-high. It is simply destruction of shareholder wealth.

Additionally, in the last 11 years, only one-third of the capital S&P 500 firms used to buyback shares resulted in a net reduction in share count. A full 1.7% of shares per year went to stock based compensation or share issuances. That’s a significant number considering the S&P 500 buyback plus dividend yield is now around 4%. Of that 4% return, around 0.25% will be taken for dividend taxes, and well over 1% will be a “phantom buyback” that shareholders hardly benefit from due to stock-based compensation and other capital actions. The true net buyback and dividend yield of the S&P 500? Certainly much less than 4%. None of that happens at Berkshire.

More concentration in better businesses. Apple is possibly the best business in the world and makes up 15-20% of the value of Berkshire compared to 5.9% of the S&P 500 index. BNSF railroad is a critical U.S. infrastructure asset that earns durable 12-15% returns on invested capital (better than average business) and also comprises 15-20% of Berkshire’s value. Its largest peer, Union Pacific, makes up a puny 0.43% of the S&P 500. GEICO and the energy business together make up yet another 15% of Berkshire’s worth, with the former earning excellent returns on a growing equity base and the latter earning a durable, regulated-monopoly return of 8-10% on investments. 

Collectively these four businesses are better than the average S&P 500 firm either measured by returns on capital, economic durability, or both. As a group they are half of Berkshire’s value. The rest of Berkshire contains smaller chunks of above and below average businesses (wholly owned subsidiaries and equities) that as a whole likely more or less reflect the economics of the S&P 500 index. Plus a large investable cash balance equal to 10% of Berkshire’s value that removes liquidity risk and destructive, poorly-timed equity issuances. The cash may also be opportunistically deployed into a better than average business, which may be Berkshire itself (buybacks), an acquisition, or a stock purchase.

The point here is that Berkshire concentrates more than the SPY fund in better businesses, has less risk, and the company’s value will be positively impacted to a greater degree by these big winners like Apple, GEICO, and BNSF railroad.

  • More logical succession planning that leads to long-term thinking, actions, and value creation. 
    • Berkshire has no mandatory retirement age for executives or board members. Many S&P 500 firms have policies to remove insiders after a certain age or tenure to refresh and maintain diverse perspectives. For individuals that have been in the business for many years or decades and have developed an expertise to make quality business judgments, it makes zero sense to kick them to the curb just because they’ve made a trip around the sun x-amount of times. It’s detrimental to the leadership and long-term health of a company.
    • The average CEO retirement age of S&P 500 firms is 60, and an average tenure of eight years. There is tremendous wisdom and expertise that comes after the age of 60 and after eight years with a company. Greg Abel is now assuming significant leadership at Berkshire at age 60, with hopes for a one to two decade run ahead. He has cumulative wisdom and experience in the business to make decisions that create long-term term value and enough time to see the results come to light down the road. Buffett told CNBC, “The likelihood of someone having a 20-year runway, though, makes a real difference.” It only makes sense that experience should be a desired trait for business leadership. S&P 500 firms put in place policies that prioritize refreshed diversity over experience.
  • Index similarity: Let winners run (forever owners) and sufficient diversification
    • Berkshire operates with a “never sell” framework. When they buy a core asset, it’s unlikely they will ever sell it regardless of overvaluation or through periods of significant underperformance. This is the same way index funds operate which allows Berkshire to catch the entire upside from the small number of investments that do extraordinarily well over time (GEICO, Coca-Cola, Washington Post, BNSF, Apple). This framework leads to the majority of index fund returns over time. Assets that don’t work out as well will be simply outgrown over time to the point they are immaterial or subsequently sold (Wells Fargo, Precision Cast Parts, newspaper business). Riding the major successes pays for several losers. The “never sell” framework also reduces taxes on capital gains and maximizes long-term compounding.
    • Sufficient diversification. While Berkshire is certainly more concentrated than an index fund, it has optimal diversification. There is more exposure to upside from great businesses, yet there is also sufficient diversification so that one significant asset impairment or bad deal will result in, at an extreme, a one or two year setback in value appreciation. There is essentially no chance of significant capital loss at Berkshire. The assets are unrelated, uncorrelated and none comprise over 20% of Berkshire’s value.

Today: Significant valuation dispersion to other assets

At $278 per share, Berkshire sells at a 6.5% earnings yield with the ability to reinvest at 9 to 11% returns for many years to come. With all earnings retained and compounded at these rates, this can lead to a 14-18% earnings yield on today’s cost, ten years from now. There are quite possibly no assets available of Berkshire’s certainty, quality, and durability that will match that yield on cost in the next ten years, assuming all distributions are reinvested. I predict Berkshire Hathaway will be one of the top performing large cap stocks and outperform the S&P 500 index over the next decade.

You can compare Berkshire’s durable 6.5% earnings yield to long-term government bonds near 2%, below investment grade corporate bonds at 4.3% and the S&P 500 earnings yield near 4%. The bonds have nowhere near the reinvestment opportunity that Berkshire does and the S&P 500 has suboptimal capital allocation while trading at a 50% premium to earnings.

Berkshire’s total operating earnings per B-share (including look-through of equity portfolio) is slightly more than that of a share of the S&P 500 index fund (SPY). A Berkshire B share is $278 whereas a share of SPY is $420. The index fund is a 50% premium for equal earnings that are of lesser quality, I believe, based on the assets that comprise Berkshire’s earnings power.

Public comparables also point to mispricing. Berkshire’s equity holdings are marked to market at $300 billion. Their BNSF railroad is a nearly identical asset to Union Pacific (in the S&P 500) which is publicly traded at $145 billion. The S&P 500 utilities sector trades at 19 times forward earnings which would imply $75 billion for Berkshire Hathaway Energy which is set to earn around $4 billion annually when including renewable energy tax credits. The utility of the cash pile is often a mystery at $140 billion, but it is clear that at least $75 billion is investable for the right opportunity.

Putting the above values together is $595 billion compared to Berkshire’s actual market cap of $637 billion. What wasn’t included above was manufacturing, service, and retail businesses earning $10 billion pre-tax, GEICO insurance earning cyclically-adjusted $2 billion pre-tax on underwriting, plus nearly $4 billion of pre-tax earnings from other insurance, equity-method investments, and preferred stock. You can try to put a precise value on these businesses, but it doesn’t really matter. These $16 billion of annual operating profits are worth more than the $42 billion difference that the market cap and public comps imply. I would reckon to say those earnings are worth around $170 – $220 billion. This would put Berkshire at a value of $770 – $820 billion if it were more appropriately comped to public S&P 500 assets. That would be $340 to $360 per B share.

Secondary evidence of this valuation and quality dispersion comes from the Vice Chairman of Berkshire, Charlie Munger. At the 2021 annual meeting, he said he prefers Berkshire over the market and thinks it will do better. Additionally, Buffett and Munger have engaged in substantial share repurchases at prices up to $260 per B share. Historically, Buffett is unwilling to invest capital without a significant discount to a conservatively estimated intrinsic value or an expectation of at least a 10% return, which would imply a value well over $300 per share at his repurchase prices. The fact that the shares traded from $175 to $230 for the majority of the last year is absurd. The large repurchases created substantial value for shareholders.

The Next 50 Years

At the annual meeting, both Buffett and Munger said they believe the Berkshire business model can go on for a very long time, at least 50 years. Munger said the runway might amaze everyone. I agree with their statements based on the facts we are seeing today, notably the flexible capital allocation and succession plans.

The Berkshire model will become more valuable over time as the Berkshire team continues the tax-efficient compounding of capital year after year, which will get easier with a flexible buyback and growing energy business capital expenditures. These simple, low-risk capital deployment tools will reduce the need to do big deals to create value. Deal sizes will continue to grow along with the economy and markets while Berkshire is able to profitably slow its growth in size to open up more investment opportunities.

Investors may continue to disregard Berkshire due to the misguided concerns I addressed. If so, the price will remain fair and buybacks will likely continue. That is very good for long-term shareholders that see the direction the company is headed. Every share repurchased has the two-fold effect of increasing shareholder ownership at a discount and also making it easier to execute the Berkshire business model.

I expect one day that Berkshire Hathaway will be a very popular stock for many different investor types. The company is in a period of transition, which it is executing flawlessly, that investors won’t appreciate until there are established financial and stock returns. The longer it takes, the better for current owners and investors with funds to deploy. Berkshire represents one of the few high-quality retirement assets available today that sells at or below fair value with the prospect for a fair long-term equity return. If Berkshire were valued to reflect the level of interest rates and comparable assets it would be priced 25% to 50% higher than current levels.

O’Reilly Auto Parts (2020)

O’Reilly Automotive | Long @ $450 | BD Capital (11/19/20)

O’Reilly is one of the largest auto parts retailers and distributors. For a detailed industry overview, I highly recommend the 2017 ORLY write-up by TallGuy.

O’Reilly’s business is essentially split between about 57% Do-It-Yourself (DIY) store retailing and 43% Do-It-For-Me (DIFM) sales to commercial service shops that perform repairs and maintenance.

Profit margins are strong because price is secondary in most decisions. In an industry with 100k+ of slow-turnover SKU’s, getting the “right part to the right place at the right time” creates very complex inventory logistics. Part availability, speed of fulfillment, and customer service is more important than the price of the part. 

O’Reilly’s distribution system gives them an advantage in the DIFM commercial business. They operate a hub-and-spoke distribution model that allows large, regional distribution centers (28) to act as storefronts for larger hub stores (356), which in turn act as storefronts for the typical small box O’Reilly store (5,600+) down the street. Over many years, the O’Reilly team has improved their system to the point that some stores receive multiple daily deliveries, seven days a week that supply the right SKU’s for stores and commercial customers. This “best-in-class” system creates reliable, nearby parts availability for many repair shops around the country. It’s very complicated.  No one has been able to match O’Reilly’s logistics at their scale.

The efficient inventory flow provides the “right part at the right place at the right time” which helps O’Reilly capture the lead position that gets the ”first call” from DIFM repair shops. First call is estimated to get the majority of a repair shop’s business and maintain the position with good service and timely fulfillment. For a good operator, it creates sticky customers. O’Reilly is the best in the industry at this.

DIFM Industry Potential

O’Reilly has an attractive growth runway because the DIFM market, where their strengths reside, is very fragmented and much larger than DIY. AAP and NAPA are the leaders at 5-6% share each. O’Reilly is close behind at 4% share and growing. There is room to take share given the large number of small part suppliers (about half of the market) that don’t have the scale or fulfillment capability of O’Reilly to maintain the “first call” position. Given the fact that “first call” suppliers are estimated to get over half of a commercial customer’s business, and O’Reilly is great at winning and maintaining the first call position, I think the opportunity is significant for O’Reilly at its current 4% market share.

The DIFM business is also a growing segment, at 3-5% per year. This should continue: The increasing complexity of vehicles means fewer people are able to do repairs themselves, so they defer to the repair shop (this could change someday with EVs). Also, upcoming generations value convenience and are less handy than older generations… making them more likely to defer to professionals for service. 

This is why ORLY tends to get a premium multiple to peers and the market. Most of the aforementioned is general industry knowledge, not why you should buy the stock today. The following factors I believe are underestimated by investors and make ORLY attractive as a multi-year hold today.

-Best of breed management team, “buyback cannibal”

-COVID disruption market share gains

-Extremely favorable car sales cycle and increasing age of vehicles on the road

Management

I believe O’Reilly is one of the best managed companies in American business. Their “promote from within” culture is unique. Here are the ages that key execs joined O’Reilly and their entry position:

CEO – age 17 – part-time distribution center employee

COO – age 26 – parts specialist

VP of store ops – age 18 – parts specialist

Sr. VP of store ops – age 21 – distribution center employee

VP of East stores – age 18 – parts specialist

VP of distribution – age 20 – distribution center employee

VP of expansion – age 22 – parts specialist

VP of West stores – age 21 – parts specialist

These guys know this business better than anyone. Directors and execs own 2.5% of the company, $825m worth of stock. Who would want to compete with them?

They are great with capital allocation to grow competitive advantages and return capital:

-Renovating stores and adding layers to the distribution system

-Entering new markets with new stores to grow footprint and sales

-Selective store acquisitions (not significant recently)

-Buyback stock at reasonable prices and heavily at cheap prices

Since Jan. 2011 they have repurchased 79.5 million shares at an average price of $170.92, for a total investment of $13.59 billion. Coming up on a decade of the program, shares outstanding have been reduced 48% from 139m to 72.5m today, net of dilution, about a 6.5% reduction per year. A lot of these repurchases come in chunks at opportunistic times:

2011: $977m repurchased at $71 – shares reduced 9.8% – investment IRR of 22.9%/yr

2012: $1,445m repurchased at $102 – shares reduced 11.2% – investment IRR of 20.6%/yr

2017: $2,172m repurchased at $253 – shares reduced 9.2% – investment IRR of 21.6%/yr

In 2017, the $2.2 billion buyback was 2.5 times free cash flow that year. That was done w/ incremental borrowings of $1.1 billion in a year that the stock fell 40% from peak.

O’Reilly maintains leverage at a Debt to EBITDAR ratio of 2.0-2.5X. As the business grows, increased leverage allows them to buy back stock in excess of free cash flow and at opportunistic times. The current growth spurt in the business which I will soon explain, and any weakness in price, is sure to see increased buybacks from a management team that is very aligned with shareholders.

Thesis: Market Share Gains, Cyclical Demand Drivers, & Operating Leverage

After the initial COVID lockdown shock, O’Reilly posted Q2 and Q3 comps at triple historic levels with operating profits up over 30%. The whole industry has benefited and ORLY has posted great numbers. The question is how much of O’Reilly’s sales bump is one-time in nature from stimulus and other government payments, and the effects of miles driven being down 12% yoy (demand driver).

I believe investors are overestimating headwinds and underestimating how much of the sales growth is here to stay due to market share gains (Q3 conference call in quotes):

#1: Elevated sales are not just from discretionary purchases driven by stay-at-home recreational activity:

“I want to be clear that even though these more discretionary categories have been our better performers for the last 2 quarters, we have still been very pleased with our sales volume across our business. While demand in under car hard part categories is more failure related and did not perform quite as strong as the company average in the third quarter, sales for these traditional categories were still robust and significantly better than historical trends.”

#2: Comp sales remained above 10% into Q4 after stimulus and unemployment benefits have lapsed:

“We’ve been somewhat surprised and definitely pleased at how steady our strong sales comps trends have been… Our sales trends are even more encouraging in light of the fading tailwinds to our business from the expiration of government stimulus payments and enhanced unemployment benefits under the CARES Act as we moved further past when those dollars were being injected into the economy… As miles driven has remained under pressure at the same time the government stimulus has ceased, we’ve been encouraged to see continued strong demand, particularly on our professional business”

#3: A significant portion of recent sales growth will be recurring due to market share gains:

“Aside for the macro benefits that have helped the automotive aftermarket, it’s also clear to us that our strong sales performance is the result of significant share gains our team has delivered over the course of the past several months… As pleased as we are with our team’s great performance in the third quarter, we know the goodwill we’ve created from meeting customers’ essential needs during this crisis will drive customer loyalty and even further business in the long term… If you look at where those market share gains are coming from, you mentioned the smaller independents, I think that is a result of supply chain string our leverage and our ability to have inventory within our supply chain and have that inventory positioned in such a way in our supply chain that gives us a competitive benefit”

“And do you think you gained more share in DIY or do-it-for-me?” 

Thomas McFall (CFO): “That’s a hard one to determine. We will see over time as others report, and we look at industry data. What we would tell you is that we think we gained significant share on both sides of the business.”

Share gains are a result of O’Reilly’s ability to weather the disruption from March to June when nearly every supply chain in the world was turned on its head. In a business built around supply chains, O’Reilly had the best fulfillment and was likely able to distribute parts in a timely manner that smaller competitors simply could not execute.

This leads me to believe that O’Reilly moved up the call depth chart and into the “first call” position for many commercial customers around the country during the pandemic. This type of business is sticky, and as long as O’Reilly continues excellent fulfillment for these customers they will be winning significant new business.

Note: I think management is tipping their hand on this new development. In four months from July through the 10-Q on Nov 2nd, they have reduced the share count nearly 2.5% spending $800m repurchasing stock in the mid $400s. This is an accelerated buyback pace, likely from management’s confidence in the new level of business and a reasonable valuation.

Cyclical Demand Drivers

Before long, I expect cyclical factors will even further elevate comps based on the new car sales cycle. Cars entering the 6-11 year old window are primed for repairs as they reach elevated mileage levels and come off warranty. This means that new car sales have a positive correlation with ORLY comps on a 6-11 year lag. This explains below average comps from ‘17-’19 due to fewer cars entering the 6-11 year window, because new car sales were down 20-40% from ‘08-’12.

We are about to see the reverse happen. In ‘14, new car sales were the highest they had been since ‘07. In ‘15, new car sales set a new record. In ‘16 they set another record. There will be a record number of cars entering the 6-11 year old window starting in 2021 and continuing through 2027… O’Reilly’s sweet spot. According to IHS Market research, this age cohort is supposed to increase 18% by 2022 and 30% by 2025. This is a very favorable demand setup for O’Reilly.

On top of that, weak new car sales during this year’s recession will increase the average age of vehicles on the road because drivers are maintaining existing vehicles for longer. Older vehicles = more repairs. From IHS Market research: 

Todd Campau, associate director of Aftermarket Solutions at IHS Markit, said, ‘However, the COVID-19 pandemic has created the perfect storm to accelerate U.S. light vehicle average age in coming years. This should be a positive side effect for the aftermarket, as the majority of repairs for older vehicles come through the aftermarket channel.’ 

An interesting comparison year for 2020 would be 2009 when new vehicles sold represented 4.2 percent of vehicles in operation and scrappage stood at 5.2 percent, resulting in a rapid increase in average age, increasing by 4 months throughout that year… In light of COVID-19, dynamics of the changing vehicle fleet are anticipated to result in an increase in average age over the coming years, perhaps of 4-6 months, according to the analysis. In turn, more vehicles will be pushed into the aftermarket sector’s “sweet spot” – thereby creating good business opportunities.

Based on the analysis, the volume of vehicles 6 to 11 years old is expected to expand, which presents major opportunities for the sector due to dealer service plans and warranties expiring, netting new business opportunities for independent service and repair shops.

IHS Markit found that the number of older cars and light trucks is growing fast, with vehicles 16 years and older expected to grow 22% to 74 million from 2018 to 2023.”

Given the aforementioned factors of share gains and cyclical tailwinds, I’m expecting a sustainable multi-year period of above-average comp sales for O’Reilly, with the 2022 three-year comp stack on 2019 nearing 20%. I expect 1-3% positive comps for ‘21 given tough quarterly Q2, Q3 and Q4 laps, which may surprise the market. The ‘22 three-year stacked comp and resulting operating leverage is what I expect to paint the best picture of the new normalized profit level. 

Operating Leverage

Operating leverage from strong comps will give O’Reilly a 2022 normalized 20-21% operating margin compared to ~19% the past few years. This will be a significant operating profit jump that ORLY is currently experiencing and should be mostly sustainable… I don’t think the market is valuing this. The company is able to leverage SG&A on 4%+ comps. The incremental operating margin for Q3 was near double existing margins and SG&A was at typical levels, up 3.6% per store y/y. This is normal SG&A growth for ORLY consisting of mostly fixed costs. In addition to this, at the end of 2019, O’Reilly’s distribution network capacity was as overbuilt as it’s been since 2014. The current network can support over 695 more stores above 2019’s store count. Current distribution expenses will continue to be leveraged on higher sales per store and new stores. In a few years, they will be doing much more business on the existing slow-growing fixed cost base.

Management hinted at keeping SG&A in check even if sales remain robust (mgmt in quotes): 

“We continue to see significant SG&A leverage in the third quarter. I think our comments around that are we’re going to manage our SG&A and our spend per store prudently so that we can react to changes in sales volume to be the same and continue at this high-low double-digit rate or to the extent that we see fluctuations that we can actively manage our expenses.”

“What we would tell you is that we are going to be conservative, that means not staffing up to the current level of business because the current level of business has been heightened from historic norms, to the extent that we can continue to drive those results, we will continue to see strong leverage.”

I suspect management is disguising operating leverage and permanent margin expansion as caution. If they weren’t confident in this new level of business and wanted to be cautious, then I don’t suspect we’d be seeing aggressive stock repurchases.

The aggressive ongoing buyback will further boost EPS. The growth in EBITDAR will justify more leverage per the company’s targets. This will be additional capital to repurchase shares. In the next two years I expect ORLY will be clear for incremental borrowings of over $2 billion due to EBITDAR growth, plus cumulative free cash flow of $3 billion. If they like the price, they should be able to repo $5 billion by YE2022. That will be a 12-14% share reduction with today’s market cap at $33 billion.

+7% expected store base growth by 2022 should drive ORLY to almost $13 billion in 2022 sales. At a 20% OM and higher interest expense, they can earn $1.8 billion for 2022 with under 64m shares outstanding. I expect $28-30 for 2022 EPS. This level of growth should surprise and show investors that ORLY deserves to trade at a premium to the market multiple, as it has in the past. 

2022 EPS at today’s market multiple would be $700/share and 55% upside, plus future EPS compounding after that. Here is a business with a great track record, a strong competitive advantage in a growing industry, and an outstanding management team that is selling at 15 times two-years-out earnings. It’s a wonderful business at a fair price in a low rate world. There are not many of these out there.

The S&P 500, which I find O’Reilly of greater quality than, is selling at 23 times 2022 estimates. I believe O’Reilly will significantly outperform in the coming years. It should be valued in-line or at a slight premium to the S&P 500, as it has historically, due to its superior growth prospects and well-maintained competitive advantages. 

Risks:

Electric vehicles may reduce the number of parts needed for vehicle repairs/maintenance which could harm O’Reilly’s business in the future. I think this development is farther away than most expect and when it occurs it will happen gradually. Low production levels, currently limited and expensive to build out infrastructure, and a slow turning vehicle fleet will slow this risk from rapidly disrupting the business. Even in an EV world, parts will need to be distributed and they will likely be more expensive which would offset reduction in transactions/basket size. O’Reilly’s gold standard distribution chain will still prove valuable for whichever direction the world moves.

IHS market research source:

https://news.ihsmarkit.com/prviewer/release_only/slug/bizwire-2020-7-28-average-age-of-cars-and-light-trucks-in-the-us-approaches-12-years-according-to-ihs-markit

Catalysts: Surprisingly strong two and three year comp stacks, Accelerated buyback, Relative valuation, Business quality

TJ Maxx and Ross Stores Will Benefit from COVID-19 Shutdown

Off-price retailers TJ Maxx and Ross Stores are second only to e-Commerce when it comes to disrupting the traditional department store model of apparel retail. Over the past few decades, the two chains have gradually taken market share from department stores and specialty retailers that operate with higher cost structures, higher inventory levels, and a bland shopping experience.

When fashion retailers and apparel manufacturers don’t sell as many goods as planned, which can be due to missed fashion trends or slow sales, TJ Maxx and Ross buy up the excess goods at fractions of retail value. This helps the sellers recoup cash from inventory that will become obsolete due to season and fashion changes. This is more beneficial for the off-pricers because the discounts allow them to sell goods in stores at up to 60%-off department store prices and very quickly. The more inefficiency there is in the inventory supply chain, the greater the deals are for TJ Maxx and Ross to pounce on. While retailers are, in a sense, feeding their enemy by selling goods to off-pricers, it makes sense for them to do so because they have high fixed costs they need to cover. Off-loading excess inventory helps cover these costs regardless of how cheap it is sold.

TJ Maxx and Ross buy their inventory later in the season than traditional retailers and  focus on quick turnover to reduce their fashion risk and inventory obsolescence. This creates a rapidly changing assortment of goods in the stores and a “treasure hunt” shopping experience. Value conscious customers love shopping at off-price stores thanks to the huge discounts and the thrill of finding an unexpected deal on name brand apparel. This is exacerbated during tough economic times when consumers need a bargain to balance their budget.

The concept does not work well in an e-Commerce format because the assortment of goods available at any given time is rapidly changing. What the off-pricers have available in stores is deal dependent and effected by what they are able to buy cheaply from excess supply. There is no guaranteed supply of product at any location or any specific time. This would be nearly impossible to operate as an online store because product supply is limited and always changing. Also, most items are $5 to $20. Such a low price point doesn’t justify shipping costs. These factors require customers to visit stores in order to get the bargains on name brand apparel. Any given store may not have exactly what a customer is looking for, but it is bound to surprise them with unexpected deals on quality goods.

Thanks to these factors, TJ Maxx and Ross have been able to successfully operate, and grow, the brick and mortar retail format unlike so many chains. They have consistently grown their store fleet, sales, and profits for many years. Yet, today they have a combined market share of less than 10% of the apparel, accessories, and home goods market. There is tons of room to grow in the space.

I’ve identified a few factors stemming from COVID-19 that will accelerate this growth:

  1. Retail bankruptcies and store closures caused by the COVID shutdown will reduce competitors in TJ Maxx and Ross markets.
  2. Huge supply of unsold spring inventory from the shutdown has created extremely out of balance inventory levels and will lead to incredible sourcing opportunities for off-price.
  3. Once the COVID health risk subsides, economic troubles will persist for consumers that will seek out TJ Maxx and Ross Stores as a place to enjoy a shopping experience and save money at the same time.

Goodbye Department Stores

The pandemic shutdown caused unprecedented disruption to retailers that were already not doing very well. Just a few months into the recession there have been numerous chains announcing bankruptcy and store closures, many of which compete with TJ Maxx and Ross Stores. Other competitors have yet to announce business changes but likely will before long due to poor financial performance.

  • Macy’s and Gap together have around 7% market share. Neither have announced store closures yet, but Macy’s has cut corporate staff. Both companies are in a poor financial position and will likely have to close underperforming stores.
  • Nordstrom, at 3% market share, is closing 19 big-box stores that are in TJ Maxx and Ross markets.
  • JC Penney, 2% market share, announced bankruptcy and is closing 150 out of 850 stores.
  • Off-price retail and direct competitor, Tuesday Morning, filed for bankruptcy and is closing half of its 687 stores, many of which are in Ross markets.
  • Ascena retail has 2% market share and plans to close 1,200 of their 3,000 stores. Ascena focuses on women’s clothing which is the primary segment for TJ Maxx and Ross.
  • J Crew filed for bankruptcy, Chicos cut 20% of its staff, and Express plans to close 100 stores by 2020

Quite clearly, the majority of brick and mortar retail is playing defense or on its way out of the game. Collectively this amounts to a significant portion of the market that TJ Maxx and Ross are out to grab. Both chains have significant cash liquidity, less capital in inventory, and low debt. They are well positioned to ride out any further COVID shutdowns. When the dust settles, there will be much less competition in their markets which will lead to a big boost in sales and market share.

Bountiful Supply

The COVID shutdown disrupted the sales plans of so many retailers and manufacturers that there is one of the largest gluts of unsold inventory in recent memory. So large, in fact, that some manufacturers have discussed packing away inventory for a full cycle and selling it next year when it is back in season. That would be unprecedented, but they can’t get rid of the inventory. Even the off-price retailers are hardly buying because of the uncertainty of the environment. On conference calls, many off-pricers have noted the size of the opportunity:

Burlington CEO: The aftermath of the pandemic may well create many of the same conditions that followed the financial crisis of 2008, specifically I think those likely could be huge availability of off-price merchandise, great values compared with weakness in the department and specialty store channels and a strong consumer need for value over the next couple of years. Those conditions should be very good for off-price.

We’re only going to be buying the very best deals, but we know our vendors know and the off-price customers certainly know that all the previous reference points for value need to be thrown out. Whatever value the merchandise had at the beginning of March is not the value that it has now. And that principle is going to be top of mind for our merchants to go back into the market.

TJX CEO: The marketplace is loaded with inventory, and I am convinced that we will have access to plenty of high quality branded merchandise to offer consumers the category they want when they shop us.

The strange dynamic is there’s so much goods out there right now, that a lot of us will not be able to use that, we believe there is going to be a lot of packaways or a holdover being done by actually the vendor community. So for the first time, obviously, this is a strange environment, and we hope we don’t run into this again for numerous reasons. It will be packaways at the vendor level, if that makes sense to you. A lot of holdover goods that will probably be showing up in the first quarter of next year.

Ollie’s CEO: I would tell you that this is probably something we’ve never seen. We experienced ’08, ’09. I think this is going to be something even larger than that and there’s going to be a lot more opportunities out there and they probably going to be a little more immediate than what we saw between ’08-’09. How large it’s going to be, I don’t know. But there’s definitely going to be problems out there. We’re starting to see cracks already, as you guys would imagine. And we’re seeing opportunities that are presenting themselves as we speak today.

We could probably take down, I probably tell you we could take down a $100 million of inventory pretty quickly… I think the opportunity is so big, it’s not going to matter. And I think a lot of people do talk about getting into the closeout business, but as we’ve already said, it’s not that easy just to decide to become a closeout retailer and do a close out product.

There will be a huge opportunity for the firms with the liquidity and systems to capitalize on big, discounted product deals. TJ Maxx and Ross are well positioned.

People Need a Bargain

The economic disruption caused by the virus shutdown has caused high unemployment and tremendous uncertainty. So far, consumers have been hesitant to shop in stores because of health risks. Shopping online makes much more sense during this time. However, once the health risk subsides but economic troubles remain, consumers will look to stretch their budget and save money on purchases they want and need to make. The best way for them to save money on apparel, accessories, and home goods will be to shop in the stores of TJ Maxx and Ross.

Their operating models allow them to offer the lowest prices and are is not conducive to the online format. People will always look to save money, so the off-price brick and mortar format will survive the pandemic. The tremendous value offered will broaden the customer base of the off-price chains, as many consumers trade down from other alternatives to save money. Many of these customers will stick around when the economy revives because they will want the savings they can achieve at TJ Maxx and Ross.

Lollapalooza Effect

A combination of flattened competitors, a historic sourcing opportunity, and an environment that lends to value-conscious behavior will cause a boom in business for leading off-price chains like TJ Maxx and Ross Stores. With plenty of market share to grab and untapped markets to open stores in, I would expect these companies to be earning significantly more money a few years down the road. They can grow at attractive rates for the next decade or longer.


Short Dollar General to Buy Dollar Tree

I am recommending to short Dollar General stock (DG) and use the proceeds to purchase Dollar Tree stock (DLTR). An investor stands to benefit from two angles: 

  1. The relative valuation between Dollar General and Dollar Tree is so wide that it doesn’t make sense. DG is currently trading at 18.5 times 2019 EBITDA vs 11 times for DLTR. The two companies operate similar business models and are impacted by the same externalities and trends. 
  2. With both uncertainty and stock market valuations high, this bet is uncorrelated with the general market. It would likely outperform in a falling market and provides opportunity for return regardless of where the market goes.


The Businesses

Dollar General is a discount retailer operating small box sizes in predominantly rural areas lacking competition. Its scale, along with low capital intensity, afford it nice margins and returns on capital. Solid execution and expansion has led to years of strong sales and cash flow growth. Management estimates potential for 25,000 stores, up 50% from current, implying 7-10 years of MSD fleet growth. Offerings for value conscious consumers help the company to thrive in difficult economic times.

Dollar Tree is also a discount retailer operating two store segments: Dollar Tree, at the $1 price point, and Family Dollar at the $10 or less price point. 

The Dollar Tree (DT) store segment has been one of the most successful retail concepts of the past several decades due to excellent returns on capital with initial store investment payback period of 18-36 months. There is still a growth runway as management believes the market can support over 10,000 DT stores, up 30% from current. The product offering is a value for consumers which gives the business defensive characteristics in tough times. The $1 price point is not feasible from an e-commerce standpoint, allowing for brick and mortar growth at high ROIC. 

The Family Dollar (FDO) segment, on the other hand, has been difficult since acquisition and severely underperformed its closest peer, Dollar General. It runs an operation nearly identical to DG, but suffers from poor sales productivity and low gross margins because of weak discretionary sales. It is currently marginally profitable.

Current Market Valuation

For two very similar businesses, the valuation discrepancy is stark.

Screen Shot 2020-07-10 at 10.28.25 AM

Clearly the valuation difference is due to profitability. Breaking it down by segments changes the story and shows how much value is being masked by the marginally profitable Family Dollar.

Screen Shot 2020-07-10 at 10.29.53 AM

The key variables here are:

  1. What will profitability look like at each segment a few years from now?
  2. What is a square foot of selling space worth at each segment?

Because investing results depend on what happens going forward, not the past, we need to try to guess where the puck is going and skate there. 

Dollar Tree vs Dollar General: Relative Comparison

The Dollar Tree segment has higher margins than DG, a similar growth opportunity, and also benefits from the same drivers: the convenience of the weekly fill-in shopping trip, selling high margin, high value discretionary items, and a defensive business model that benefits in tough environments. The Dollar Tree segment profited 20% more per square foot than DG in 2019. If DG has an EV of $402/sq ft then it is warranted for the Tree segment to be worth at least that, if not more, on a purely comparable basis. It earns more and is just as high quality.

On the basis of conservatism I will give the Tree segment the same EV/sq ft as DG of $402.

Next. The big question is whether Family Dollar will improve profitability. The market’s pricing implies they won’t, but I believe they will, partly thanks to COVID-19 boosting value shopping behavior and also the H2 renovation program. 

Now, FDO sales per store are roughly $1.4 million vs. almost $1.8 million per store for DG, even though the two have similar box sizes and offerings. FDO gross margins lag DG by about 500 bps from both weak sales volumes and a product mix that needs more discretionary sales at high margins.

On the bright side, FDO compares favorably on the basis of SG&A efficiency. FDO’s SG&A has averaged 21.9% of sales the past two years compared to 22.3% of sales for DG in 2019. This is rather surprising considering much of SG&A is fixed costs that should deleverage with lower sales. This confirms that there is a gross profit problem for FDO and better merchandising can lead to much higher profitability. 

Fortunately, a few things are working in Family Dollar’s favor:

  1. The H2 renovation program is boosting comp sales over 10% in the first year, continuing for almost two years now.
  2. COVID’s effect in the most recent quarter had comp sales up 15% and operating income up 91% at the FDO banner
  3. Adding Dollar Tree branded $1 discretionary product sections in FDO stores

I believe these factors will improve Family Dollar’s profitability in a manner like so:

Screen Shot 2020-07-10 at 10.32.36 AM

COGS has some fixed costs which should expand gross margin on higher sales along with better merchandising from the $1 Dollar Tree product additions. SG&A is roughly two-thirds fixed costs and will not rise nearly as much as sales. Consequently, the sales boost from H2 and merchandising changes should increase operating profits in a big way. To back up these numbers, note that FDO actually just posted a 4.2% operating margin in Q1 with comp sales up 15% compared to my pro-forma margin of 4.1%.

If this is to be executed, Family Dollar would then be making about half as much as Dollar General per sq ft. Not the best but not nothing. While DLTR management does think FDO can double its store base, due to its uncertainty I will value it at 40% per sq ft of what the market is valuing Dollar General. That would be $161 EV per sq ft at FDO.

So, I believe that the Dollar Tree segment should be valued just as richly as DG, which today is $402 per sq ft. And due to the factors I’ve listed that already began to develop in Q1, FDO should be worth around 40% of DG’s value, which is $161 per sq ft. It will require $2.5 billion to complete the H2 program on all stores which I will deduct from FDO’s value.

These factors leave us with:

Screen Shot 2020-07-10 at 10.36.20 AM

Today, DLTR trades at less than half of the price of DG, even though reasonable comparable valuations would show that DLTR should be worth around two-thirds of DG. 

For many years, the two used to trade largely in-line on a per-share basis until Q3 2018 when Family Dollar started to trend poorly. Sentiment has entirely shifted since then to create a massive valuation gap that blew out in 2020.

If DG is worth $189 as the market says, then DLTR should be worth at least $128. That is 40% higher than the current market price. This pair trade would generate around 35% return net of borrow costs thanks to a low DG dividend. Additionally, it would be uncorrelated to the general market which isn’t super appealing to be long right now. I’m not sure if Dollar General’s price needs to come down or Dollar Tree’s needs to go up to correct this valuation gap, but upcoming quarterly results from the Family Dollar segment should highlight how comparable the two businesses are and expose a relative undervaluation of DLTR stock.

Catalysts

Quarterly results: material Family Dollar operating income growth, comps pick up at Dollar Tree

DG valuation declines: its currently trading at 18.5 times 2019 EBITDA vs. 11 times for DLTR

Corporate action: Sale or spin-off of Family Dollar and an independent valuation for Dollar Tree segment similar to DG valuation


CarMax (KMX)

CarMax is the largest used car retailer in the United States. This writeup was encouraged by potential catalysts stemming from the coronavirus crisis that did not exist just a month ago. CarMax will be better positioned going forward than if this crisis did not occur due to an aversion to public transportation, weak competitors going out of business, and accelerated adoption of omni-channel initiatives. 

Business

CarMax sold 833,000 used cars at retail in the past year, sold another 466,000 at wholesale auctions, and holds 70,000 retail vehicles in inventory. This massive scale provides the company with several important advantages:

  1. Inventory breadth: With 70,000 used cars to select from that vary by age, color, mileage, and interior packages, consumers are more likely to find the specific car they want at CarMax as compared to smaller dealers. For a fee, customers can have cars transferred to them from the 217 CarMax stores around the country. 
  1. Data advantage: Being involved in ~100,000 used car transactions each month and a strong auction presence gives CarMax critical data on fluctuating used car values and consumer preferences. This data allows for accurate pricing in both buying and selling vehicles and is needed to manage a consistent gross margin. Smaller competitors are unlikely to have an inventory system as robust as CarMax’s due to less complete information, which makes it harder to identify what is in demand and at what price. 
  1. Buying power: With the largest retail distribution network, CarMax is able to buy in size from fleets such as rental car companies and lower its cost per vehicle.
  1. Brand/trust: While price will outweigh provider in most car decisions, CarMax has established itself as a trustworthy dealer in an industry with blemishes. They pioneered no-haggle prices (for vehicles and loan terms) and have a strict reconditioning process that all retail vehicles go through before being retailed. 

Growth & Reinvestment Runway

The used car market is fragmented. CarMax is by far the largest player, yet only commands 4.7% market share. The next handful of competitors each have a fraction of that share. The rest of the market consists of small dealerships around the country. CarMax has gradually taken market share from these competitors due to the advantages listed above complemented by a strong financial position capable of weathering economic storms, such as the current environment.

It is estimated that in its older markets CarMax has achieved 5 to 10% market share. This indicates future market share gains from the current 4.7%, as one-third of CarMax stores are less than five years old and not at full capacity yet. CarMax plans to open 10 to 15 new stores each year in its goal to reach 300 stores, which implies several more years of 5% store count growth. There is a significant opportunity for capital reinvestment and a long runway to take market share. These gains show up in existing store sales growth of 3 to 5% per year, historically. Combined with annual store expansion of 5%, it is reasonable to expect 8 to 10% growth in earnings power for several years.

Capital Allocation

CarMax is a cannibal, aggressively repurchasing its shares with any cash flow that is not used to fund store or IT investments. Since 2013, they have reduced shares outstanding from 226 mil to 163 mil today, a reduction of 28% in total and 4% per year. Free cash flow available to fund buybacks should grow faster than earnings due to slowing new store capital expenditures relative to net income. At a high free cash flow conversion rate north of 85% going forward, it is fair to expect CarMax to buyback 5% of their shares per year given they are typically valued at ~6% earnings yield.

Over time, with 8 to 10%/yr growth in earnings from market share gains and new stores plus 5% reduction in shares each year, there is clearly a path to an above average rate of return for the next decade if CarMax is able to maintain and strengthen their competitive advantages. Now I will make the case for why CarMax will emerge from the COVID19 crisis better positioned for the long-term than if it had not happened.

Coronavirus Catalysts

  1. Weaker competitors folding will accelerate market consolidation. CarMax just reported that used car sales are down 50% due to the coronavirus shutdown. They have $700m in cash, another $300m in available credit, and own most of their stores plus $2.8 billion worth of inventory that is a source of cash that they can liquidate. CarMax also noted they can cut expenses by 25% in order to slow any cash burn until the economy restarts. CarMax will make it. On the other hand, smaller firms that don’t have access to credit will have limited liquidity while sales are remarkably low. Depending on the length of the shutdown, smaller firms and leveraged firms may close up shop or go bust. In that case, their market share will go to the bigger players like CarMax.
  2. Reduction in ride share and public transit. Ride sharing results in reduced car ownership and transaction levels which is a headwind to CarMax’s growth. Unfortunately for society, any form of sharing has been halted in the midst of this pandemic. It is hard to forecast the extent of behavioral changes as a result of the COVID19 crisis, but there will be aversion to public transportation and ride sharing as we endure this period of avoiding contact with people and touched surfaces at all costs. This will boost used car ownership because those avoiding public transit still need a cheap alternative to get to work once we resume activity. Of this new base of car owners, some will likely return to public transit once it is safe to resume human contact. Undoubtably, though, some won’t resort to old habits and will prefer to keep the individualism of owning a car. This effect is a positive for the used car market and CarMax.
  3. Acceleration of omni-channel adoption. In 2019, CarMax gradually rolled out its express pickup and home delivery options to select markets which resulted in significant market share gains in those locations. Now, during a pandemic, curb pickup and home delivery are a critical alternative relative to stores that are either closed or limited to appointment-only visits. In light of this, CarMax has accelerated the program rollout to be available everywhere this year. As a result of COVID19, curb pickup and home delivery adoption should accelerate as consumers have more time to shop cars online and learn about new, convenient ways to buy from CarMax while generally avoiding the stores. The execution and adoption of these programs firm wide should result in substantial market share gains as evidenced by the initial rollout in 2019.

Valuation

I will not spend much time forecasting profits in this unprecedented environment. No doubt, they will be down significantly this year. The qualitative aspects of the business will be the driver of long term results. Nonetheless, in the past three years Carmax earned $888m, $842m, and $644m while total U.S. used car sales were at ~40 mil/year. This is a typical level of sales given U.S. used car sales have averaged 39.6 mil/year since 2000 which includes a severe recession in the data. Assuming corporate tax rates will eventually go back up to at least 27%, CarMax has after-tax earnings power of roughly $830 million based on the past two years pre-tax earnings which had reduced margins from the omni-channel rollout. This number has an element of conservatism and is reasonable. With 163m shares outstanding @ $54, CarMax is valued at $8.8 billion which is around 10.6 times after tax earnings that are set to compound over the next decade. With government bond yields close to zero, this is a very attractive price to pay for a dominant market leader with structural, long-term tailwinds that is positioned to see a boost in market share once the economy resumes normal activity. 

An alternative view of the growth algorithm: At a 9.4% earnings yield on 4/6/2020, CarMax can repurchase around 8% of the shares outstanding with a year’s free cash flow once sales recover. With earnings power growing at 8 to 10% per year and shares dropping at 8%/yr, EPS has a very real potential to compound at over 15% from these valuations. That is unlikely to last due to efficient markets, so the stock will rerate higher eventually. Without assigning a price target, I suggest an investor hold this investment for the long term. Let a great business and compounding do the work for you. 

Catalysts

-Weaker competitors lead to market share gains

-Reduction in public transit boosts used car ownership

-Increased omni-channel adoption

-Compounding value

Disclosure: I hold a position in KMX stock.


Update on Wells Fargo

To see my first post on Wells Fargo, click here: Wells Fargo (WFC)

At under $44 a share on August 15th, I’m finding the stock to be very attractively priced at this point. Wells Fargo continues to get punished by the market, largely due to declining interest rates, an inverted yield curve, and recession fears. These are legitimate risks worth assessing, however I find the fears to be overblown as a lot of these risks were already priced into the stock. A reversal in any of these trends or a shift in sentiment may cause the stock to rapidly correct upward due to strong capital returns.

Rates

At their latest meeting in July, the Federal Reserve cut interest rates 25 basis points to sustain the expansion of the economy. This is somewhat bad news for banks, as it reduces the interest they can earn on assets. While they can lower the rates paid on deposits, it isn’t a one for one offset and it’s unlikely to completely make up for the lost income. Also, this week, the 2-year treasury yield surpassed the 10-year yield, which further pressures net interest margins as banks borrow short and lend long.

John Huber, portfolio manager at Saber Capital Management, recently made a note on Twitter regarding the history of U.S. bank net interest income that promotes a longer term view than the one the market seems to be adopting currently. Since rates peaked in 1982, net interest income in the banking system has risen in all but two years while rates declined and, generally, net interest margins compressed.

fredgraph

fredgraph-2

fredgraph-3.png

Put simply, banking profits continue to rise over the long run regardless of what’s going on with rates at any given point in time. The key factor for the long term investor’s profits is growth in the economy and banking assets, as rates are bound to be at a different level and headed in a different direction at any point in the future.

In Wells Fargo’s quarterly report, they also outlined the effect of interest rates declines. As of 6/30/19, if there were a 100 basis point decrease in rates, it is estimated that net interest income would be down $0.7 – $1.2 billion in the first year and $2.6 – $3.1 billion in year two. This effect would result in declines of roughly 5% and 14%, respectively, in net income if there were no offsetting pickup in business, which I find unlikely. In a case of lower rates, there would likely be a pick-up in economic activity and borrowing, which would generate substantial fees for the non-interest income side of Wells Fargo as they originate massive amounts of loans. This is the benefit of the resiliency of Wells Fargo’s diversified banking business. While this situation would certainly present headwinds, it appears to have limited downside, be short-term in nature, and it hasn’t even come to fruition yet.

Credit Quality

The inverted yield curve has the market betting more and more on a recession occurring in the near future, which may come true but is nearly impossible to predict. One thing that is certain is that we will experience a downturn eventually. Thanks to the Fed’s asset cap placed on Wells Fargo, they are as prepared as any of the banks to weather an economic storm due to the high credit quality of their loans.

In their recent quarterly report, the consumer loan segment showed markable improvement in credit quality. Just because the bank can’t grow assets doesn’t mean it can’t grow quality and in turn strengthen its earnings resiliency. Here’s a look at the FICO score mix changes from 12/31/18 to 6/30/19:

wells ficos

In the first half of 2019, total consumer loans were up just $1.76 billion, or 0.4%, but this minuscule change due to the asset cap doesn’t paint the full picture. Loans to FICOs above 720 increased $8.57 billion, or 2.7%, and $4.79 billion of that increase came in the highest quality 800+ FICO segment, which was up 2.6% in the first six months of the year. That’s not all. Loans in which the highest loss rates will arise in a recession continued to decline. Loans to FICOs under 720 decreased $4.07 billion, or 4.6%. The low quality PCI loans purchased from Wachovia were also down almost $4 billion.

And this is just through six months. Wells Fargo is pruning its balance sheet. Because they aren’t allowed to grow, the next best thing is to minimize the loans that will generate the most loss and grow the highest quality loans. Therefore, Wells Fargo is continuing to grow in quality.

Buybacks

On the company’s third quarter conference call, the CFO reiterated the capital plan which will return $32.1 billion to shareholders in the next year. $23 billion of that will come through share buybacks and he stated that they plan to front load the program with 65% of the buybacks occurring in the first two quarters. That would be $15 billion in six months and over $117 million per trading day through December, which can retire over 2.7 million shares a day at the closing price of $43.38 on 8/15/19.

The six month buyback figure of $15 billion is equal to 7.8% of the current market cap. If the share price remains in this area through the end of 2019, the company could very well retire over 7% of the shares outstanding by New Years. Notably, this is being done at five-year low valuation multiples for a company making a pretty steady $20 billion or so (give or take 5-10%) a year.

I think the probability that the summer and fall of 2019 buybacks make existing long term owners of Wells Fargo a lot of money is fairly high. There just could not be better timing for short term pessimism when you are reinvesting profits into a beaten down stock price.

Happy investing.

Bryce Dooley

Disclosure: I am long WFC.

Wells Fargo (WFC)

If you have been keeping up with the financial news over the past few years, it is likely you’ve seen plenty of negative headlines about Wells Fargo. You may have heard their name thrown around in political discussions. Lately, Wells has become the poster child for corporate wrongdoings and big bank greed. This is because of a scandal uncovered in 2016 where employees of the bank were found to have opened fake accounts on behalf of customers in order to hit quotas and receive fat paychecks for doing so. These accounts did not cause severe financial issues for any individuals, but generated small fees for a lot of customers that should not have been charged. People have not forgotten the history of wrongdoings of the big banks and Wells has not been spared any mercy, thus creating serious headline risk for the company.

Throughout the past few years, Wells has had executive turnover and is now on its third CEO (who is only interim CEO) since prior to the scandal. In addition, the Federal Reserve has placed an asset cap on the bank and is not allowing them to grow until they meet strict compliance and internal control demands. Their progress in meeting those demands has been disappointing to this point and there is no timetable for the cap removal.

Financially, Wells is doing ok but is not as profitable as they were prior to the bumpy ride they’ve been on. The low interest rate environment continues to pressure interest income in the banking industry as a whole. Wells also has to deal with their own costs which have ballooned over the last couple years due to the large legal and personnel costs needed to navigate their way through an operational risk management transformation. From 2013-2015 prior to the scandal, the bank’s efficiency ratio, which measures non-interest expenses to revenue, was just above 58%. It is now up to 65%. Like golf, lower is better.

It is safe to say there is now legitimate pessimism surrounding the company which was once the golden standard in the financial sector and is a longtime favorite of legendary investors. I see this as an opportunity, as the bank’s core advantages remain intact and its wounds can gradually be healed. And not often has the business been available to buy as cheap as it is now.

The Business

Wells Fargo’s brand and products are very well entrenched in the American economy. The bank serves 1 in 3 households in the U.S. Through its well diversified segments, it offers a full suite of products from mortgages to student loans to credit cards to wealth management services. Wells’s revenues are essentially split; a little over half comes from interest income and the rest from other fee generating products. This somewhat insulates profits from temporary variations in interest rates or declines in other fee businesses, such as mortgage originations. The bank focuses more on traditional banking – taking in deposits and lending them out – and less on trading and investment banking, which fluctuate with the capital markets.

There are advantages that come with doing business with 1 in 3 households in the country. One is the stickiness of the relationships. Most of Wells’s customers have several products with the bank, like a checking account, credit card, student loan, investment account, and a mortgage, making it difficult and a serious hassle to switch banks. Because of this stickiness and a well distributed physical presence, Wells gets consistent access to $766 billion of low-cost retail deposits, a top figure in the industry that powers attractive returns without taking undue risks. The stickiness of these deposits is evidenced, very importantly, by the fact that customers have not fled the bank following the account opening scandal. Community banking deposits at the time of the scandal hitting the news (September 2016) were $708 billion. Today they are 8% higher. These cheap deposits are a large portion of funding for the bank’s assets and give it a cost advantage over rivals that have to use more expensive forms of funding for their assets.

Another advantage Wells Fargo has comes from scale and its ability to cross sell products. It is a lot cheaper to sell a product to an existing customer than to a new customer. The bank’s former CEO, Richard Kovacevich, explained this in a 2011 interview:

“The cost of selling an incremental product to an existing customer is about 10% of the cost of selling that same product to a new customer. Isn’t that intuitive and obvious? You don’t open up a new account. You don’t advertise. You don’t take other risks.

Because the margin is so high, you can actually give some of that margin back to the customer. You can say to the customer: ‘If you bring over your Treasury management product, your business or personal insurance, your credit card, your 401(k) or whatever, I’m going to give you a better deal than the competitor who is selling you only one product because of the 10% cost versus that 100% cost.'”

Because Wells already has a massive customer base it can sell them new products at prices much cheaper than what they would pay for a similar service at another institution. This also creates a virtuous cycle in which Wells Fargo’s customers, and their valuable low-cost deposits, become further entrenched at the bank as it continues to grow the average products used per household, a measure I think of as the glue that keeps their finances stuck at the bank. The bank’s deposit market share has grown at a steady clip the past several decades and now sits at 11%. While it’s unreasonable to expect them to repeat the impressive growth of the past, once the asset cap is lifted they can still take market share going forward as one of the most efficient operators in a consolidating industry.

Historically, Wells has operated with a very prudent underwriting culture. They avoided the devastating financial risks leading up to last decade’s real estate bust which allowed them to opportunistically acquire Wachovia and grow market share at attractive returns while less disciplined competitors were playing defense. Their conservative risk-taking history allows them to have the lowest capital reserve surcharge of the big four banks that are considered global systemically important banks. This allows Wells to generate profits with less capital than peers, enhancing returns for shareholders in the process. There is no reason to believe that underwriting standards have wavered in relation to the account opening scandal as credit metrics are healthy (loan charge-off rate of 0.30% and low subprime FICO score exposure) and management is de-risking the balance sheet to manage the asset cap.

Investment Thesis

It is my belief that the core sustainable advantages of Wells Fargo’s business listed above are still intact. The bank is dealing with largely temporary issues that have its profits and investor sentiment in the gutter. There are five areas I’ve identified where upside potential could be meaningful or risk reduced:

  1. Management is improving the bank’s asset quality by selling riskier assets to stay under the asset cap. This should result in stronger performance during an economic downturn and allow for attractive capital deployment opportunities when the asset cap is lifted. In addition, this is currently reducing the average yields earned by the bank and compressing their net interest income margin. Wells Fargo’s net interest margin was lower in 2018 than it was in 2015, even though interest rates bottomed in 2015. I think this and the next point are causes of an under-earning asset portfolio that won’t remain over the long term.
  2. Another source of margin compression is the persisting unfavorable interest rate environment for banks. A 200 basis point increase in interest rates would increase Wells Fargo’s income by over 10% from current levels. I don’t know where rates will go, but a reversion to the mean would suggest upward.
  3. Yet one more source of margin compression is the bloated non-interest expenses I discussed earlier. I think this is our most likely and largest source of upside potential. The bank has already made progress on this front compared to last year. If management can get the efficiency ratio to the upper 50%’s range of their past, that would increase net income by around 15-20%. A removal of the asset cap will be needed to get most of this benefit by scaling fixed costs, however Wells is reducing its branch count now and enacting some personnel cuts that should continue the positive trend in this area. NOTE: An interesting point here is the fact that Wells Fargo has 26.5% more employees and 35% more branches than Bank of America even though they serve only 6% more customers, have only 9.9% more retail consumer deposits and 5.75% less in total deposits, and 20.1% less assets than BAC. In other words, I think Wells is pretty fat right now. Once a permanent CEO is in place, I think his/her first priority will be efficiency, and it seems there is enough opportunity here to generate significant operating leverage like Bank of America has demonstrated in years past.
  4. Wells has a fortress balance sheet right now. Not just the improving asset quality that I referred to before, but a capital reserve ratio of 11.9% currently is well above regulatory requirements and the bank’s 10% target. Getting to 10% with no growth would release $24 billion back to shareholders, which is 11.7% of the current market cap. That’s a full year of attractive return just in excess capital. Share buybacks and dividends have been massive recently and should continue to be hefty for 2-3 more years, providing a boost to earnings per share.
  5. I believe the probability of any negative surprises related to internal controls, customer service, or operational risk to be greatly diminished at this time as regulators and politicians have been watching the company like a hawk for several years now. Any other missteps would have likely been uncovered already. Also, everyone at the firm should be on their best behavior to move on from recent mistakes as fast as possible (and to not find themselves on the front page of the Wall Street Journal or as one of Elizabeth Warren’s campaign talking points).

Valuation

Wells Fargo’s market cap is $205 billion and they generated $22.4 billion of earnings in 2018. That’s a 10.9% yield on the price. But because Wells has excess capital that is likely to be returned in the next few years, I find it reasonable to subtract that $24 billion from the current price to find the net. That would leave Wells selling for $181 billion, bringing us to a 12.4% yield on last year’s earnings.

For one of the least changing, profitable businesses around that is so important to our global financial system that the government won’t allow it to fail, I think that’s a pretty good deal considering the low-to-mid-single digit yields on most investments today. Once the asset cap is lifted, management will attempt to get costs in line with the bank’s past as the focus will shift from satisfying regulators to operating lean. If they succeed at reclaiming their margin profile, that would bring earnings to roughly $27 billion. We also need to adjust for full cycle credit charge-offs, as management has provided an estimate for normalized charge-offs that is about double the current levels. This would reduce earnings by $2 billion to ~$25 billion, a 13.8% yield on our net price.

If that outlook is too rosy for you, assume earnings remain flat in the next five years. Wells could return $136 billion if it paid out all earnings each year and the excess capital to shareholders. That’s two-thirds of the current price returned in the first five years, a staggering amount when compared to alternative investments. If you value the business on a discounted cash flow basis, the valuation is front loaded with capital return which makes it much more certain of a valuation than one in which uncertain growth in future cash flow is extrapolated far into the future. This certainty, combined with a business as stable as Wells Fargo, is very valuable for an investor looking to make a confident, sizable investment. I believe risk of loss is very low.

A lot of the capital will be deployed through share buybacks, which will increase per-share value and do so rapidly if any upside materializes. It is quite possible that Wells will decrease its shares outstanding by around 25% in the next three years depending on the share price and timing of the asset cap removal. A 25% reduction in shares combined with $25 billion in earnings (based on a margin profile that I believe they can attain due to reasons listed above) would be $7.39 of earnings per share. The stock sells for about $45 now. That’d be a 16.4% yield on cost. How long it may take to execute on a cost reduction program is hard to tell, however value is being created now with a 4% dividend yield, tons of buybacks, and low risk of capital loss. If no earnings growth materializes we are still left with a 12.4% yield on the net price. In a business as durable as Wells Fargo, I’ll take that any day.

As the asset cap is lifted, Wells will be able to begin reinvesting in its core business again which generates attractive returns on capital in the mid-teens. This will compound value over time and likely cause the market to apply a higher multiple on the earnings and book value to adjust for the rate of increase in intrinsic value. Right now the stock is at just a 1.17 premium to book value, a discount to its historic multiple and another safety net against severe capital loss.

Catalysts

  • Tons of buybacks
  • Positive Federal Reserve stress test and capital plan results in next two weeks
  • Permanent CEO put in place
  • Asset cap removal
  • A more hawkish Fed

Disclosure: I hold a position in WFC stock.

Bryce Dooley

MMA Capital Holdings (MMAC)

Company Overview

MMA Capital is a micro-cap company ($180 million market cap) that primarily lends money on renewable energy infrastructure and real estate projects. Per the company, they focus on investments with attractive returns that generate positive environmental or social impacts. The firm’s two business segments are Energy Capital and its Other Assets and Liabilities which consist of real estate partnerships, bonds, and other investments.

MMA Capital seems to have a rather complicated business when looking at the financial statements, and in the past this has been true. Along with the complication, the company never quite focused on a primary business segment to create consistent income and has been valued based off of its balance sheet (net worth) due to this. However, now management is simplifying the business to focus on the core renewable energy lending business. In this business, the company has been able to generate unleveraged ROIs of 15.8% on $929.6 million of loans since the segment was started in 2015, with no loss of invested principal. In order to invest more in this area, management has been divesting other assets and businesses to free up equity capital. As this has progressed, the business and financial statements are becoming clearer and a path to steady earnings is beginning to emerge.

Management

In a transformational transaction last year, MMA sold several of its investments to Hunt Investment Management, LLC and in doing so also became externally managed by Hunt, who took over the origination, servicing, and management portions of the renewable energy project lending segment of MMA. Not only that, Hunt also took in all employees from MMA. Put simply, MMA is now essentially a renewable energy lending fund with third party management. The best part of this transaction was the incentivized compensation system set up for Hunt, who controls MMA’s destiny from here on. Hunt’s management fee is based on a percentage of book value, or net worth, of MMA, with the percentage being increased whenever MMA crosses $500 million of book value or whenever MMA’s annual return on book value is in excess of 7%. For perspective, MMA’s book value is currently just over $200 million. Again, to simplify, Hunt makes a lot more in management fees the sooner that MMA gets to $500 million in book value and the better that MMA performs. In addition to this assuring incentive system, Hunt has purchased a significant stake in MMAC stock. MMA’s CEO, Mike Falcone, owns 5.6% of the company and the rest of the execs/board own another 11.4% for total insider ownership of the company of 17%.

Clearly, management’s interests are aligned with shareholders in all respects.

Business Strategy

Management’s strategy is to continue to invest capital into the renewable energy lending business in order to generate steady earnings. This will further their other goal, which is to grow book value per share. To accomplish this, they have been selling non-core assets and repurchasing shares at discounts to book value. For you non-accountants out there, this is an action that increases book value per existing share just by eliminating shares at a cost less than their book value. So far, the strategy is working.

Screen Shot 2019-05-09 at 9.43.26 PM


So where is all the growth in book value coming from if the company lacks stable earnings power? Well, it starts with their balance sheet, which has long been misunderstood and some would argue incorrectly marked. Here is the GAAP reported balance sheet of the last two years:

Screen Shot 2019-05-09 at 7.58.25 PM

No need to worry if you have no clue what you just looked at. The key item to be aware of  is the Total Equity line item, which stands at $212.91 million. That is the company’s net worth today, which is higher than the valuation the company trades for on the market. That in itself is opportunity to profit from, as buying at a 20% discount to book value is comparable to buying a dollar bill at $0.80, given there aren’t serious problems with the company or any questionable accounting issues.

What really makes this interesting are the things that are not being reported on the balance sheet. For example, MMA has $396 million Net Operating Loss (NOL) carry forwards that can be written off against future income to reduce taxes paid. At the corporate tax rate of 21%, these NOLs can eliminate $83 million of future taxes. This is an asset in my opinion, as the company is now laser focused on the renewable energy segment to generate profits and start utilizing these NOLs, which expire between 2028 and 2035. Oddly, this value is not reported on the balance sheet as a deferred tax asset that will boost book value growth as the company starts to generate steady profits.

Along with this, MMA has investments in real estate partnerships and land that are carried at cost on the balance sheet, even though they were purchased several years ago or are currently being developed and are likely worth more than their reported value. It is tougher to put a number on this value but MMA’s history of realizing significant gains on sales of assets, largely the reason for the growth in book value of the past few years, gives these assets upside optionality whenever they are sold.

Finally, MMA has a large amount of long term, low cost, fixed rate subordinate debt which is reported at its principal balance rather than its estimated fair value based on an appropriate discount rate. The liability is carried at $97.7 million on the books, but is estimated to have a fair value of $40-$55 million when discounting with appropriate market yields. The overstatement of this liability is evidenced by the $4.8 million gain MMA booked in 2017 when they paid off $26.4 million of the discounted debt. That is a significant gain relative to the amount that was reported as a liability.

Valuation

Here is my estimate of the true economic balance sheet based on the above factors:

True Economic Balance Sheet
Cash $34,000.00
Investments in debt $97,200.00
Investments in partnerships $158,200.00
Loans held for investment $67,500.00
Other $11,100.00
NOLs $83,200.00
Assets $451,200.00
Debt $107,500.00
Equity (book value) $343,700.00
Shares outstanding 6,037.00
Book value/share $56.93

I’m not entirely sure why the reported balance sheet is so far from what seems to be reality, but my guess is that management is leaning on the side of conservatism because 1) that is a good idea in general and 2) they own a large amount of stock, and the longer it trades at a discount to its economic value the more money they can make by buying on the open market and repurchasing shares for the company. They have continued pulling rabbits out of the hat to generate gains and book value growth from areas that aren’t noticed at first glance or by casual followers.

As you can see, by adding the value of the NOLs and lowering the debt to its appropriate fair value, MMA’s net worth goes from $212.91 million to roughly $340 million. This is not clear cut but rather an estimate, because the value of the NOLs declines each year that they go unused and should probably be discounted for that reason. However, with the company valued at $180 million today, there is a significant margin of safety in the case that 1) the renewable energy lending business fails to continue making money or 2) the off balance sheet value potential that I just discussed is never realized. In that case you are still buying the company below its reported net worth, and you are investing right alongside the CEO, the Board of Directors, and MMA’s external manager. The incentives are right for value creation for shareholders, and unless you were planning to buy $10 million of the stock, the CEO will lose more than you if he fails to execute. Fortunately, I expect he will be making a pretty penny when its all said and done.

With a share price near $31 today, a reported book value of $36 per share, and true economic book value likely over $50 per share, I think MMAC is an attractive investment based upon:

  1. Attractive business: renewable energy lending has proven attractive returns
  2. Management aligned with shareholders: insiders own 17% of the company
  3. Margin of safety: the company is selling at a ~14% discount to its book value
  4. Upside potential: the NOLs and cheap debt should materially increase book value

Another stated goal of management is for the share price to trade at or above book value. This has been tough to achieve somewhat due to how fast they’ve grown book value through strategic transactions, but if they were to accomplish this then the investment will likely prove to be very successful. Most importantly, there is minimal risk of permanent capital loss due to the purchase discount to a conservatively stated book value.

On top of all this, no analysts cover the stock… less competition for us.

Thanks for reading.

Bryce Dooley

Disclosure: I hold a position in MMAC stock

Dollar Tree (DLTR)

Dollar Tree is one of the top chains of small format discount retail stores in America. They own and operate stores under the Dollar Tree brand which sells all items for $1 and also the Family Dollar brand (acquired in 2015) which uses a multi-price point strategy for low cost items.

Investment Thesis

  • Industry: Dollar Tree operates in the discount retail industry, which appears to be highly competitive, however the past is evidence that there are attractive margins and profits for the two major players – Dollar Tree and Dollar General. The two firms have grown their store counts at a torrid pace to force consolidation in the small format discount retail space. Smaller chains and mom and pop shops lack the scale needed for purchasing power and to spread their fixed costs over a large revenue base. The business model is also not easy to replicate as evidenced by Walmart’s attempt to steal market share a few years ago. They began opening small box “Walmart Express” stores to compete with Dollar General. The stores were unsuccessful and after a few years they were all closed due to supply chain complexities. If Walmart can’t enter the small format discount retail niche, that is a good sign for the existence of barriers to entry. Just as important, the industry is mostly resistant to online sales, as it is uneconomic to ship low priced items in small batch sizes.
  • Value Proposition: Dollar Tree’s prices are very similar or cheaper than most big box retailers or grocery stores offering the same products. Therefore, the small store format’s value comes from its convenience. Dollar Tree stores are often located much closer to shoppers than, say, a Walmart. A Dollar Tree can be found in the neighborhood, whereas a Walmart would likely be on the edge of town. Not only is the proximity usually more convenient but so is the shopping experience. Shoppers can get in and out of a Dollar Tree store very quickly, in contrast to the large parking lots and deep stores that require a lot of walking for big box retail shopping. All of this leads to small format discount stores becoming the one stop shop for what is called the “weekly fill-in”, when shoppers grab a few things they need to last them until the next trip to a big box store to really stock up. The value of these convenient stores has allowed Dollar Tree to organically grow sales at existing locations at a healthy clip by taking market share from big box retailers.
  • Management: The business is run by CEO Gary Philbin and Chairman Bob Sasser. Sasser was CEO from 2004 until 2017 and grew annual operating income from $294 million to over $2 billion in his tenure. Philbin became CEO last year and has been with the company since 2001 in various positions which leads me to believe he has a firm understanding of the business. Several executives have been with the company for almost a decade or more and an outsider was not hired to take over the CEO position. It is good to see a promote from within philosophy. The company does not pay a dividend and focuses on opening new stores then returns any additional cash through share buybacks. This is ideal because the store returns are exceptional while buybacks increase shareholder ownership of a compounding business.
  • Growth Potential: Currently the company has a bit over 15,000 stores. Management states that the market can support up to 25,000 stores in total implying significant growth that would come from both banners. The potential for the store count to nearly double is important because of the ROIs generated by new stores. Dollar Tree banner stores tend to have an investment payback period of around 3 years and return on capital over 30% that grows over time due to sales growth from market share gains. Family Dollar banner stores currently have a lower return profile as management is still attempting to optimize the business from prior mismanagement before it was acquired. However, the Family Dollar stores are very similar to Dollar General stores which have high returns on capital, so there is certainly potential upside for Family Dollar banner store returns.
  • Predictability: Dollar Tree is less vulnerable to an economic slowdown than most businesses, which a result of their low cost value prop. The company performs well in tough times. Some consumers will trade down in a recession to save money at Dollar Tree and Family Dollar which can result in loyal customers for any future economic environment once these customers are exposed to the value of the stores. Operating margins have historically been stable around 8-12% with a decline recently due to the acquisition of the lower margin Family Dollar business. The firm has had 42 consecutive quarters of positive same store sales growth which is an impressive feat and testament to the stability of the business and favorable secular trends.

Current Issues

The business and stock price have been facing difficulty lately as the Family Dollar stores have proven to be a tough integration since they were acquired in 2015. At that time the business was very poorly managed and Dollar Tree management has been faced with the task of optimizing the business so that profitability is comparable to Dollar General’s. Through three years, management has been able to generate improvement in operating margins, however, the full turnaround has not yet happened and is taking much longer than anyone expected. Sales growth has been much slower than the Dollar Tree banner and is dragging down the full company metrics. Additionally, a lot of debt was taken on to fund the acquisition that is now being paid down and thereby limiting the investments in new stores and stock buybacks.

I think that the market is being too impatient in punishing the stock over Family Dollar issues. By number of stores, it was the largest retail integration in history. Given more time, Dollar Tree’s experienced management team can further improve on operating metrics that have already improved some. Additionally, the acquisition roughly doubled the company’s store count which creates a lot more capital investment opportunities at high returns.

Valuation

In the last twelve months, Dollar Tree has generated operating income of $1.97 billion and free cash flow of about $1.13 billion after investing in stores. This compares to a market cap of $19.3 billion.

I think a 10% operating income yield is very attractive given the growth ahead for the company. A large portion (almost half) of the operating income is being invested back into the business for new stores and store renovations. This is very important for shareholders because these investments will generate returns ranging from 10-30%. With 4% expected store growth, 3-4% historic same store sales growth, and a 6% free cash flow yield, per share value can grow at ~14% for several years. This rate can be higher if Family Dollar achieves operating margins similar to Dollar General.

Valuing the Dollar Tree banner alone, we have $1.05 billion of net income for 2017. At the market average multiple of 17, which I think is conservative for a recession resistant company with excellent returns on capital, this business segment is valued at ~$17.9 billion. Subtract that from the current market cap and the market is implying the Family Dollar segment to be worth about $1.4 billion. This even though the segment generated $517 million of operating income in 2017 and recorded assets, net of goodwill, of $7.54 billion at year end. The total company has $5 billion of debt which is being paid down pretty quickly.

I think there is a lot of upside at the current price for patient investors that can wait for the outcome of Family Dollar. Even if the hoped for results never materialize, today you can pay a fair price for the Dollar Tree banner (a wonderful business) and get Family Dollar for cheap.

Bryce Dooley